
13 Top-Performing Large-Blend Funds
ETFs from Fidelity, JPMorgan, and Invesco stand out.


Large-blend stock funds are among a diversified portfolio’s most important building blocks. Investors have increasingly turned to passively managed funds when putting money to work in large-blend investments, but the category is also home to winning active funds.
Funds such as Fidelity Advisor Diversified Stock FDESX and JPMorgan US Large Cap Core Plus JLPSX have posted results surpassing their large-blend peers. Our screen includes seven actively managed funds. In addition, two follow sustainable investing strategies.
- Columbia Contrarian Core SMGIX
- Fidelity Advisor Capital Development O FDETX
- Fidelity Advisor Diversified Stock O FDESX
- Fidelity Large Cap Stock FLCSX
- Fidelity US Sustainability Index FITLX
- Invesco S&P 500 Quality ETF SPHQ
- iShares ESG MSCI USA Leaders ETF SUSL
- iShares MSCI USA Quality Factor ETF QUAL
- JPMorgan US Equity L JMUEX
- JPMorgan US Large Cap Core Plus I JLPSX
- Vanguard Growth & Income Inv VQNPX
- Vanguard Mega Cap ETF MGC
- Xtrackers MSCI USA ESG Leaders Eq ETF USSG
One common denominator among the top performers is a portfolio tilted toward large growth stocks (particularly technology stocks), which have generally been the market’s strongest group.
Large-Blend Funds vs. the US Stock Market
What Are Large-Blend Funds?
Large-blend funds are considered fair representations of the overall US stock market in terms of size, growth rates, and price. Stocks in the top 70% of the capitalization of the US equity market are defined as large-cap. The blend style is assigned to portfolios where neither growth nor value characteristics predominate. These portfolios tend to invest across the spectrum of US industries, and owing to their broad exposure, their returns are often similar to those of the S&P 500 Index.
Screening for the Top-Performing Large-Blend ETFs
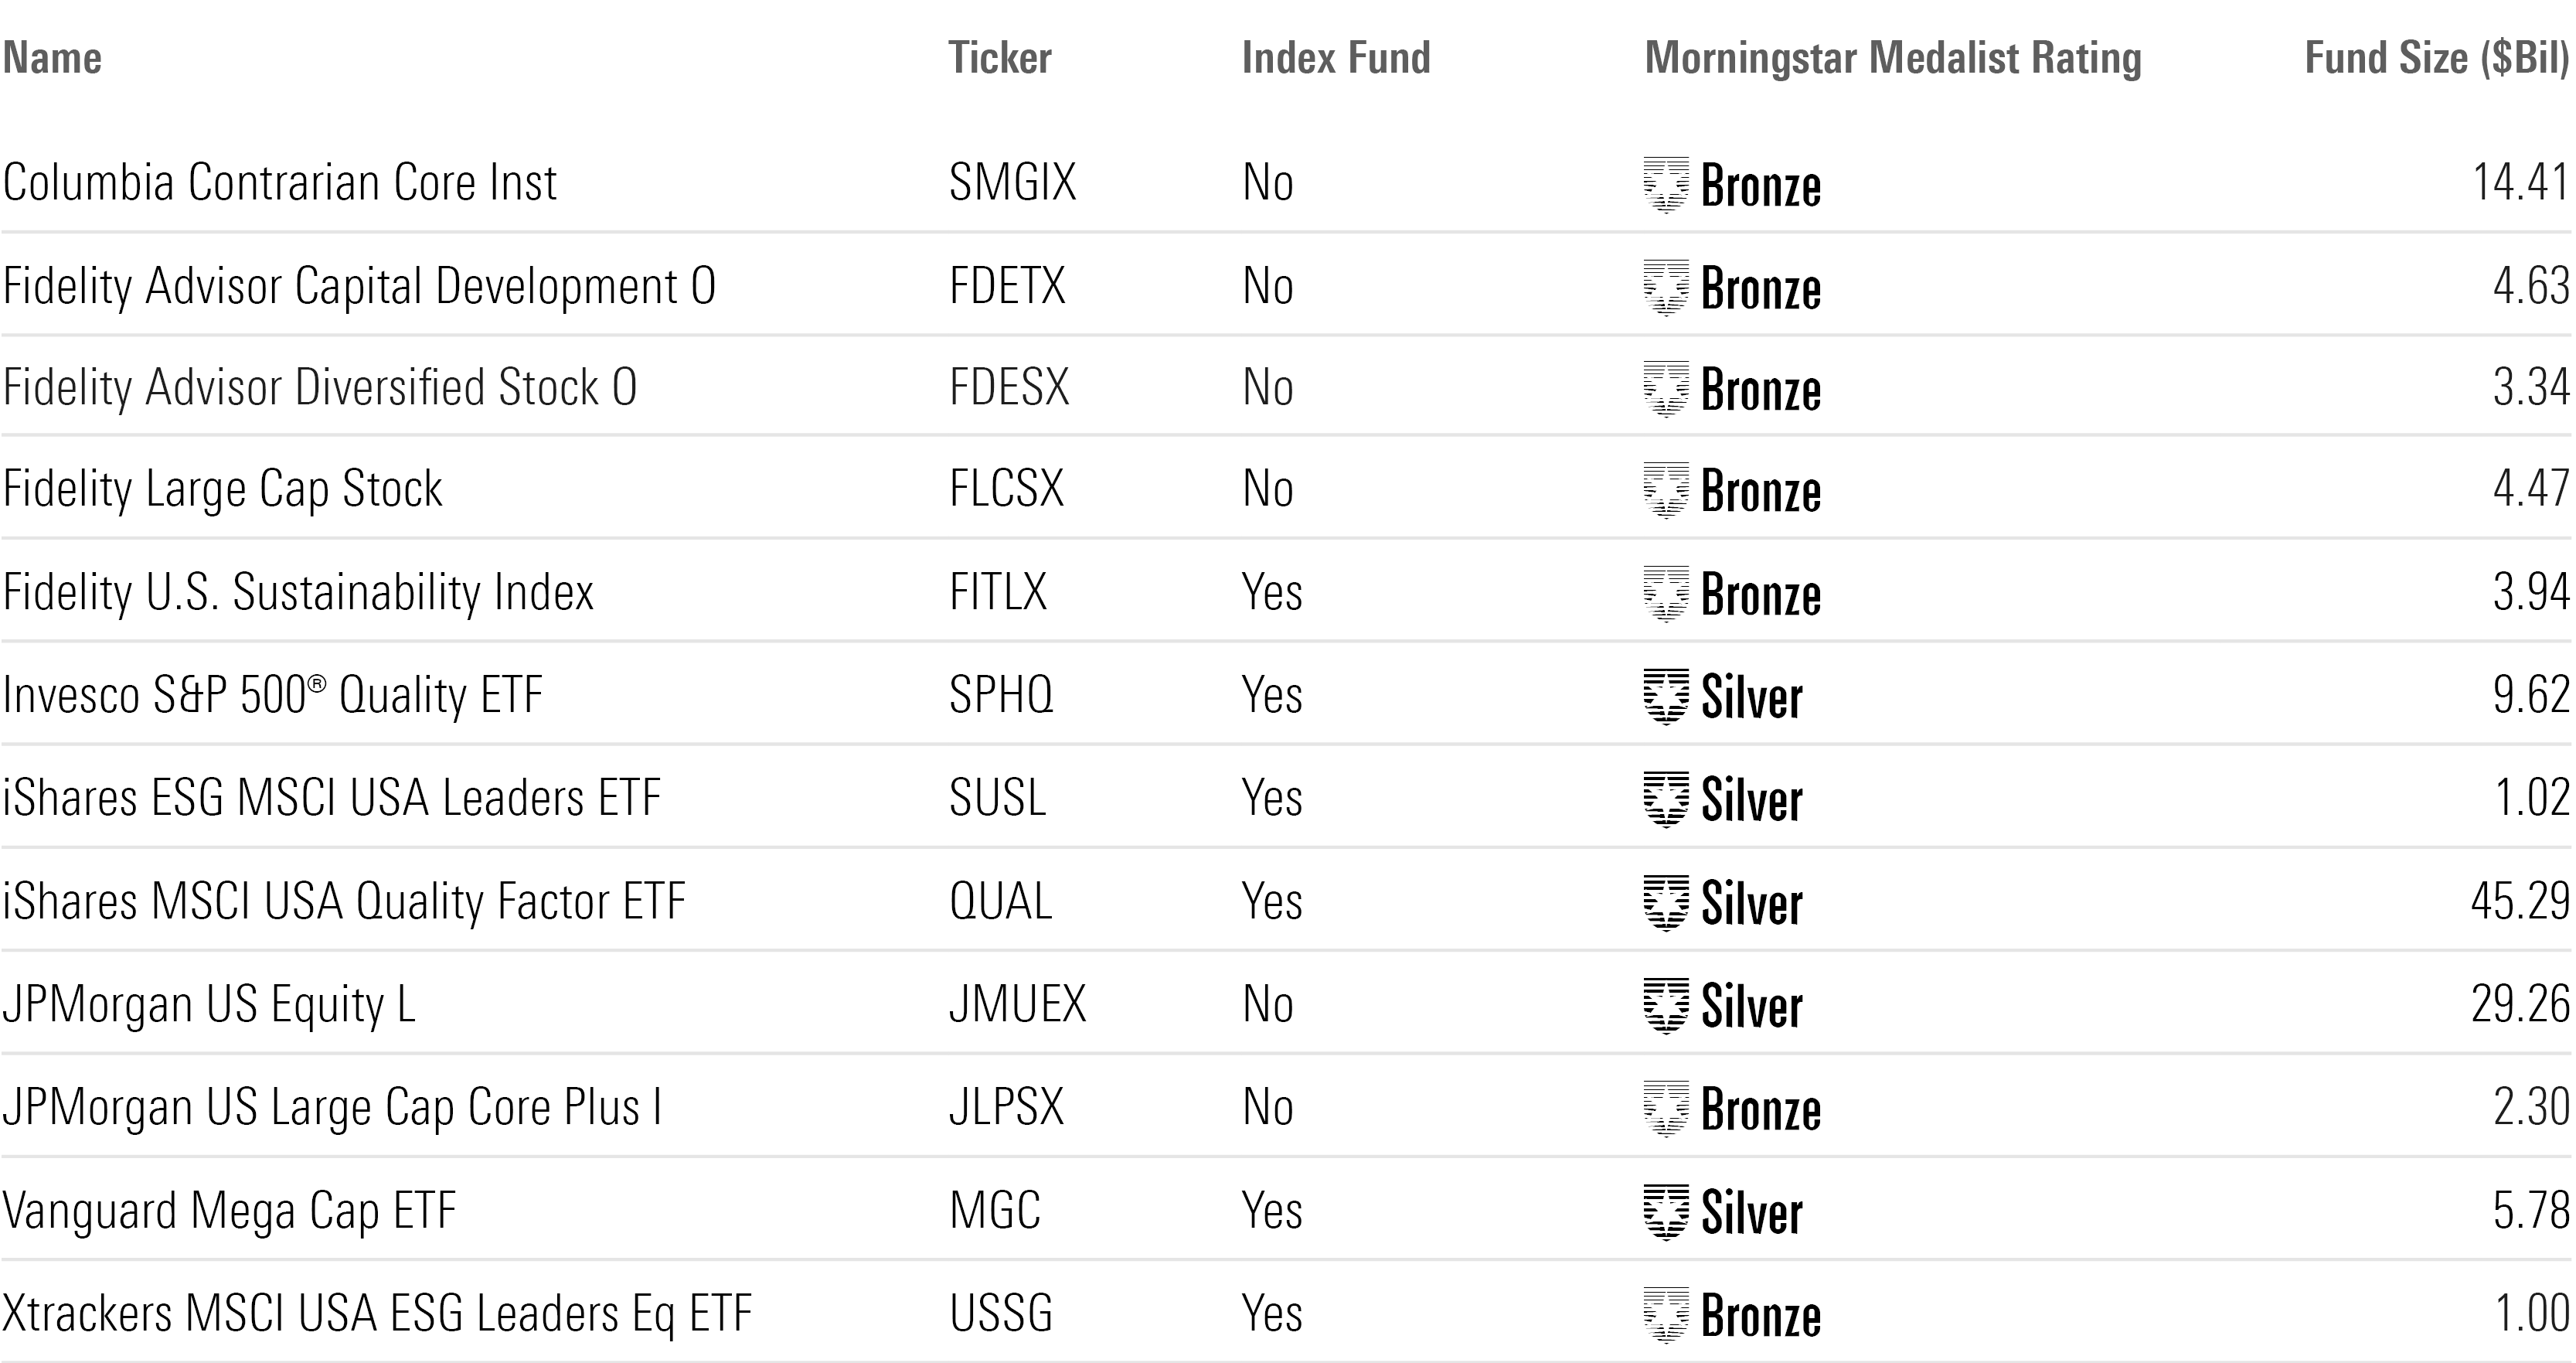
To find the top-performing large-blend funds, we looked at returns data from the past one, three, and five years. We screened for open-ended and exchange-traded funds in the top 25% of the category using their lowest-cost primary share classes for those periods. We also filtered for funds with a Morningstar Medalist Rating of Bronze, Silver, or Gold. We excluded funds with assets under $100 million and analyst coverage that was not 100%. This left us with 13 names: six index funds and the other seven actively managed.
Because the screen was created with the lowest-cost share class for each fund, some may be listed with share classes that are not accessible to individual investors outside of retirement plans, or they may be aimed at institutional investors and require large minimum investments. The individual investor versions of those funds may carry higher fees, reducing returns to shareholders. In addition, Medalist Ratings may differ among the share classes of a fund.
Top-Performing Large-Blend Funds
Columbia Contrarian Core Inst
- Ticker: SMGIX
- Morningstar Medalist Rating: Bronze
- Morningstar Rating: 5 stars
The actively managed Columbia Contrarian Core Fund is up 30.20% over the past year, outperforming the average fund in the large-blend category, which rose 23.71%. The $14.4 billion fund has gained 10.11% over the past three years, while the average fund in its category is up 7.81%. Over the past five years, the fund has climbed 16.36%, compared with the 13.38% gain for the category.
“The team and process work well together. The process affords the managers flexibility and freedom in choosing which stocks and industries to study, while portfolio guidelines and reviews instill discipline and rigor. A simple screen for market pessimism limits the universe, then managers sift through the contrarian list to pick a stock they find interesting and examine whether its troubles are fleeting or enduring. Hypotheses are tested through consultation with bench analysts and meetings with corporate management. The team prepares best- and worst-case exit strategies for every position in the portfolio of 80 or so names, part of a solid overall risk management framework. Price targets can grow with a stock, allowing the portfolio to hold growthier names longer.”
—Drew Carter, manager research analyst
Fidelity Advisor Capital Development O
- Ticker: FDETX
- Morningstar Medalist Rating: Bronze
- Morningstar Rating: 4 stars
The $4.6 billion Fidelity Advisor Capital Development Fund rose 28.83% over the past year. The gain on the actively managed fund beat the 23.71% gain on the average fund in the large-blend category. Over the past three years, the Fidelity fund is up 11.23%, while the average fund in its category is up 7.81%. Over the past five years, the fund has climbed 15.66%, compared with the 13.38% gain for the category.
“Armed with deep industry knowledge and insights from Fidelity’s sprawling team of equity analysts, manager Matt Fruhan has a fighting chance of beating the market over the long term. Since 2005, he has consistently plied a gritty approach that often embraces unloved or fundamentally challenged companies, avoids firms whose shares he thinks have been bid up by market mania, and looks for secular-growth companies whose magnitude or duration of growth is underappreciated. At the core of his bottom-up approach is the belief that the market routinely misprices companies’ earnings power over a multiyear horizon.”
—Robby Greengold, strategist
Fidelity Advisor Diversified Stock O
- Ticker: FDESX
- Morningstar Medalist Rating: Bronze
- Morningstar Rating: 5 stars
The actively managed Fidelity Advisor Diversified Stock Fund is up 33.40% over the past year, outperforming the average fund in the large-blend category, which rose 23.71%. The $3.3 billion fund has gained 10.51% over the past three years, while the average fund in its category is up 7.81%. Over the past five years, the Fidelity fund has climbed 17.25%, compared with the 13.38% gain for the category.
“Daniel Kelley embraces stocks across the style spectrum and is mindful of the fund’s stock- and sector-level divergences from its prospectus benchmark, which relative to large-growth indexes has much greater exposure to energy and financials, much less in consumer cyclicals and technology, and half as much in the equity market’s two most valuable companies, Apple AAPL and Microsoft MSFT.”
—Robby Greengold
Fidelity Large Cap Stock
- Ticker: FLCSX
- Morningstar Medalist Rating: Bronze
- Morningstar Rating: 4 stars
The $4.5 billion Fidelity Large Cap Stock Fund rose 27.98% over the past year. The gain on the actively managed fund beat the 23.71% gain on the average fund in the large-blend category. Over the past three years, the Fidelity fund is up 10.93%, while the average fund in its category is up 7.81%. Over the past five years, the fund has climbed 15.54%, compared with the 13.38% gain for the category.
“At the core of manager Matt Fruhan’s bottom-up approach is his belief that the market routinely misprices companies’ earnings power over a multiyear horizon. He hunts for downtrodden cyclical firms whose market expectations are undeservedly gloomy and secular-growth companies whose magnitude or duration of growth is underappreciated.”
—Robby Greengold
Fidelity US Sustainability Index
- Ticker: FITLX
- Morningstar Medalist Rating: Silver
- Morningstar Rating: 4 stars
Over the past year, the passively managed Fidelity US Sustainability Index Fund rose 29.37%, while the average large-blend fund gained 23.71%. The $3.9 billion fund has climbed 10.29% over the past three years, outperforming the average fund in its category, which rose 7.81%. Over the past five years, the Fidelity fund is up 15.66%, while the average fund in its category is up 13.38%.
“The fund fully replicates the MSCI USA ESG Leaders Index. The index screens for companies with the best ESG scores and weights them by their market capitalization. Its starting universe, the MSCI USA index, captures the large- and mid-cap portion of the investable US market. The index requires a minimum MSCI ESG rating and controversy score, and it excludes companies involved in controversial businesses. Companies with ties to controversial and nuclear weapons face stricter screens. The remainder of its exclusions are based on the amount of revenue firms derive from these businesses.”
—Lan Anh Tran, manager research analyst
Invesco S&P 500 Quality ETF
- Ticker: SPHQ
- Morningstar Medalist Rating: Silver
- Morningstar Rating: 5 stars
The passively managed Invesco S&P 500 Quality ETF is up 30.68% over the past year, outperforming the average fund in the large-blend category, which rose 23.71%. The $9.6 billion fund has gained 11.51% over the past three years, while the average fund in its category is up 7.81%. Over the past five years, the Invesco fund has climbed 15.64%, compared with the 13.38% gain for the category.
“Its portfolio scores among the best in terms of quality factor exposure, and its weighting scheme and constraints keep risks at bay. It receives an Above Average Process rating.”
—Bryan Armour, director of passive strategies research for North America
iShares ESG MSCI USA Leaders ETF
- Ticker: SUSL
- Morningstar Medalist Rating: Silver
- Morningstar Rating: 4 stars
The $1 billion iShares ESG MSCI USA Leaders ETF rose 29.75% over the past year. The gain on the passively managed fund beat the 23.71% gain on the average fund in the large-blend category. Over the past three years, the iShares fund is up 10.41%, while the average fund in its category is up 7.81%. Over the past five years, the fund has climbed 15.75%, compared with the 13.38% gain for the category.
“This strategy holds securities with low exposure to ESG risk relative to those of its peers in the Morningstar US Equity Large Cap Blend category, earning it the highest Morningstar Sustainability Rating of 5 globes. ESG risk provides investors with a signal that reflects how exposed their investments are to material ESG risks, including climate change, biodiversity, product safety, community relations, data privacy and security, bribery and corruption, and corporate governance. ESG risk differs from impact, which is about seeking positive environmental and social outcomes.”
—Morningstar Manager Research
iShares MSCI USA Quality Factor ETF
- Ticker: QUAL
- Morningstar Medalist Rating: Silver
- Morningstar Rating: 5 stars
The passively managed iShares MSCI USA Quality Factor ETF is up 31.80% over the past year, outperforming the average fund in the large-blend category, which rose 23.71%. The $45.3 billion fund has gained 10.39% over the past three years, while the average fund in its category is up 7.81%. Over the past five years, the iShares fund has climbed 15.01%, compared with the 13.38% gain for the category.
“IShares’ index portfolio management team fully replicates the MSCI USA Sector Neutral Quality Index. This benchmark starts by ranking all MSCI USA Index constituents by a composite quality score that embodies their return on equity, debt/equity, and year-over-year earnings-per-share growth over the past five years. Stocks are compared against their sector peers to facilitate cleaner comparisons. To reach its holdings target of 125 names, the index adds the highest-scoring stocks from each sector until it reaches that limit.”
—Zachary Evens, manager research analyst
JPMorgan US Equity L
- Ticker: JMUEX
- Morningstar Medalist Rating: Silver
- Morningstar Rating: 5 stars
The $29.3 billion JPMorgan US Equity Fund rose 28.26% over the past year. The gain on the actively managed fund beat the 23.71% gain on the average fund in the large-blend category. Over the past three years, the JPMorgan fund is up 10.24%, while the average fund in its category is up 7.81%. Over the past five years, the fund has climbed 16.75%, compared with the 13.38% gain for the category.
“Despite generally investing in 50-60 stocks, this portfolio hasn’t behaved all that differently from its S&P 500 benchmark, and that is due to manager Scott Davis’ work alongside JP Morgan’s central team of sector analysts. Analysts rank stocks in their coverage universe, but Davis doesn’t simply pick the ones on top. He challenges analysts on their picks, pinning their ideas against others that possess similar business characteristics, all with the goal of building a portfolio that will substantially assume the same factor risks as the benchmark. The portfolio’s sector weightings tend to differ from those of the benchmark as Davis considers the correlations between stocks more than their official labels.”
—Adam Sabban, senior manager research analyst
JPMorgan US Large Cap Core Plus I
- Ticker: JLPSX
- Morningstar Medalist Rating: Silver
- Morningstar Rating: 5 stars
The actively managed JPMorgan US Large Cap Core Plus Fund is up 34.92% over the past year, outperforming the average fund in the large-blend category, which rose 23.71%. The $2.3 billion fund has gained 12.81% over the past three years, while the average fund in its category is up 7.81%. Over the past five years, the JPMorgan fund has climbed 18.14%, compared with the 13.38% gain for the category.
“The managers’ proven ability to effectively exploit the alpha potential of the firm’s deep bench of sector analysts through longs and shorts earns the strategy an upgrade of the Process Pillar rating to Above Average from Average.”
—Jeffrey Schumacher, fund analyst
Vanguard Growth & Income Inv
- Ticker: VQNPX
- Morningstar Medalist Rating: Bronze
- Morningstar Rating: 4 stars
Over the past year, the actively managed Vanguard Growth and Income Fund rose 28.56%, while the average large-blend fund gained 23.71%. The $14.9 billion fund has climbed 10.07% over the past three years, outperforming the average fund in its category, which rose 7.81%. Over the past five years, the Vanguard fund is up 15.20%, while the average fund in its category is up 13.38%.
“Vanguard plans to replace its Quantitative Equity Group’s roughly 32% stake with a fundamental approach from Wellington in August 2023. It intends for this move to marginally increase the strategy’s differentiation from its S&P 500 benchmark, which it typically sticks close to. Independent sector teams run Wellington’s portfolio, allowing each team to develop a philosophy that best fits their respective industry or style. Within the technology sector, for example, the team looks for companies with positive near-term catalysts and uses volatility to build positions.”
—Andrew Redden, manager research analyst
Vanguard Mega Cap ETF
- Ticker: MGC
- Morningstar Medalist Rating: Silver
- Morningstar Rating: 5 stars
The $5.8 billion Vanguard Mega Cap Index Fund rose 29.08% over the past year. The gain on the passively managed fund beat the 23.71% gain on the average fund in the large-blend category. Over the past three years, the Vanguard fund is up 10.41%, while the average fund in its category is up 7.81%. Over the past five years, the fund has climbed 15.90%, compared with the 13.38% gain for the category.
“The CRSP US Mega Cap Index holds stocks constituting the top 70% of the US market. The index implements buffers along its lower market-cap boundary to mitigate unnecessary turnover. It removes holdings only when they pass the 76% market-cap breakpoint, and it adds new securities when they pass the 64% breakpoint. This has kept turnover below 10% during the past 10 calendar years through 2023. It also spreads the rebalancing process over a five-day period to reduce potential market impact costs. The index reconstitutes quarterly.”
—Mo’ath Almahasneh, associate manager research analyst
Xtrackers MSCI USA ESG Leaders Eq ETF
- Ticker: USSG
- Morningstar Medalist Rating: Bronze
- Morningstar Rating: 4 stars
The passively managed Xtrackers MSCI USA ESG Leaders Equity ETF is up 29.67% over the past year, outperforming the average fund in the large-blend category, which rose 23.71%. The $1 billion fund has gained 10.40% over the past three years, while the average fund in its category is up 7.81%. Over the past five years, the Xtrackers fund has climbed 15.75%, compared with the 13.38% gain for the category.
“The fund fully replicates the MSCI USA ESG Leaders Index. The index screens for companies with the best ESG scores and weights them by their market capitalization. Its starting universe, the MSCI USA Index, captures the large- and mid-cap portion of the investable US market. The index requires a minimum MSCI ESG rating and controversy score, and it excludes companies involved in controversial businesses. Companies with ties to controversial and nuclear weapons face stricter screens. The remainder of its exclusions are based on the amount of revenue that firms derive from these businesses.”
—Lan Anh Tran
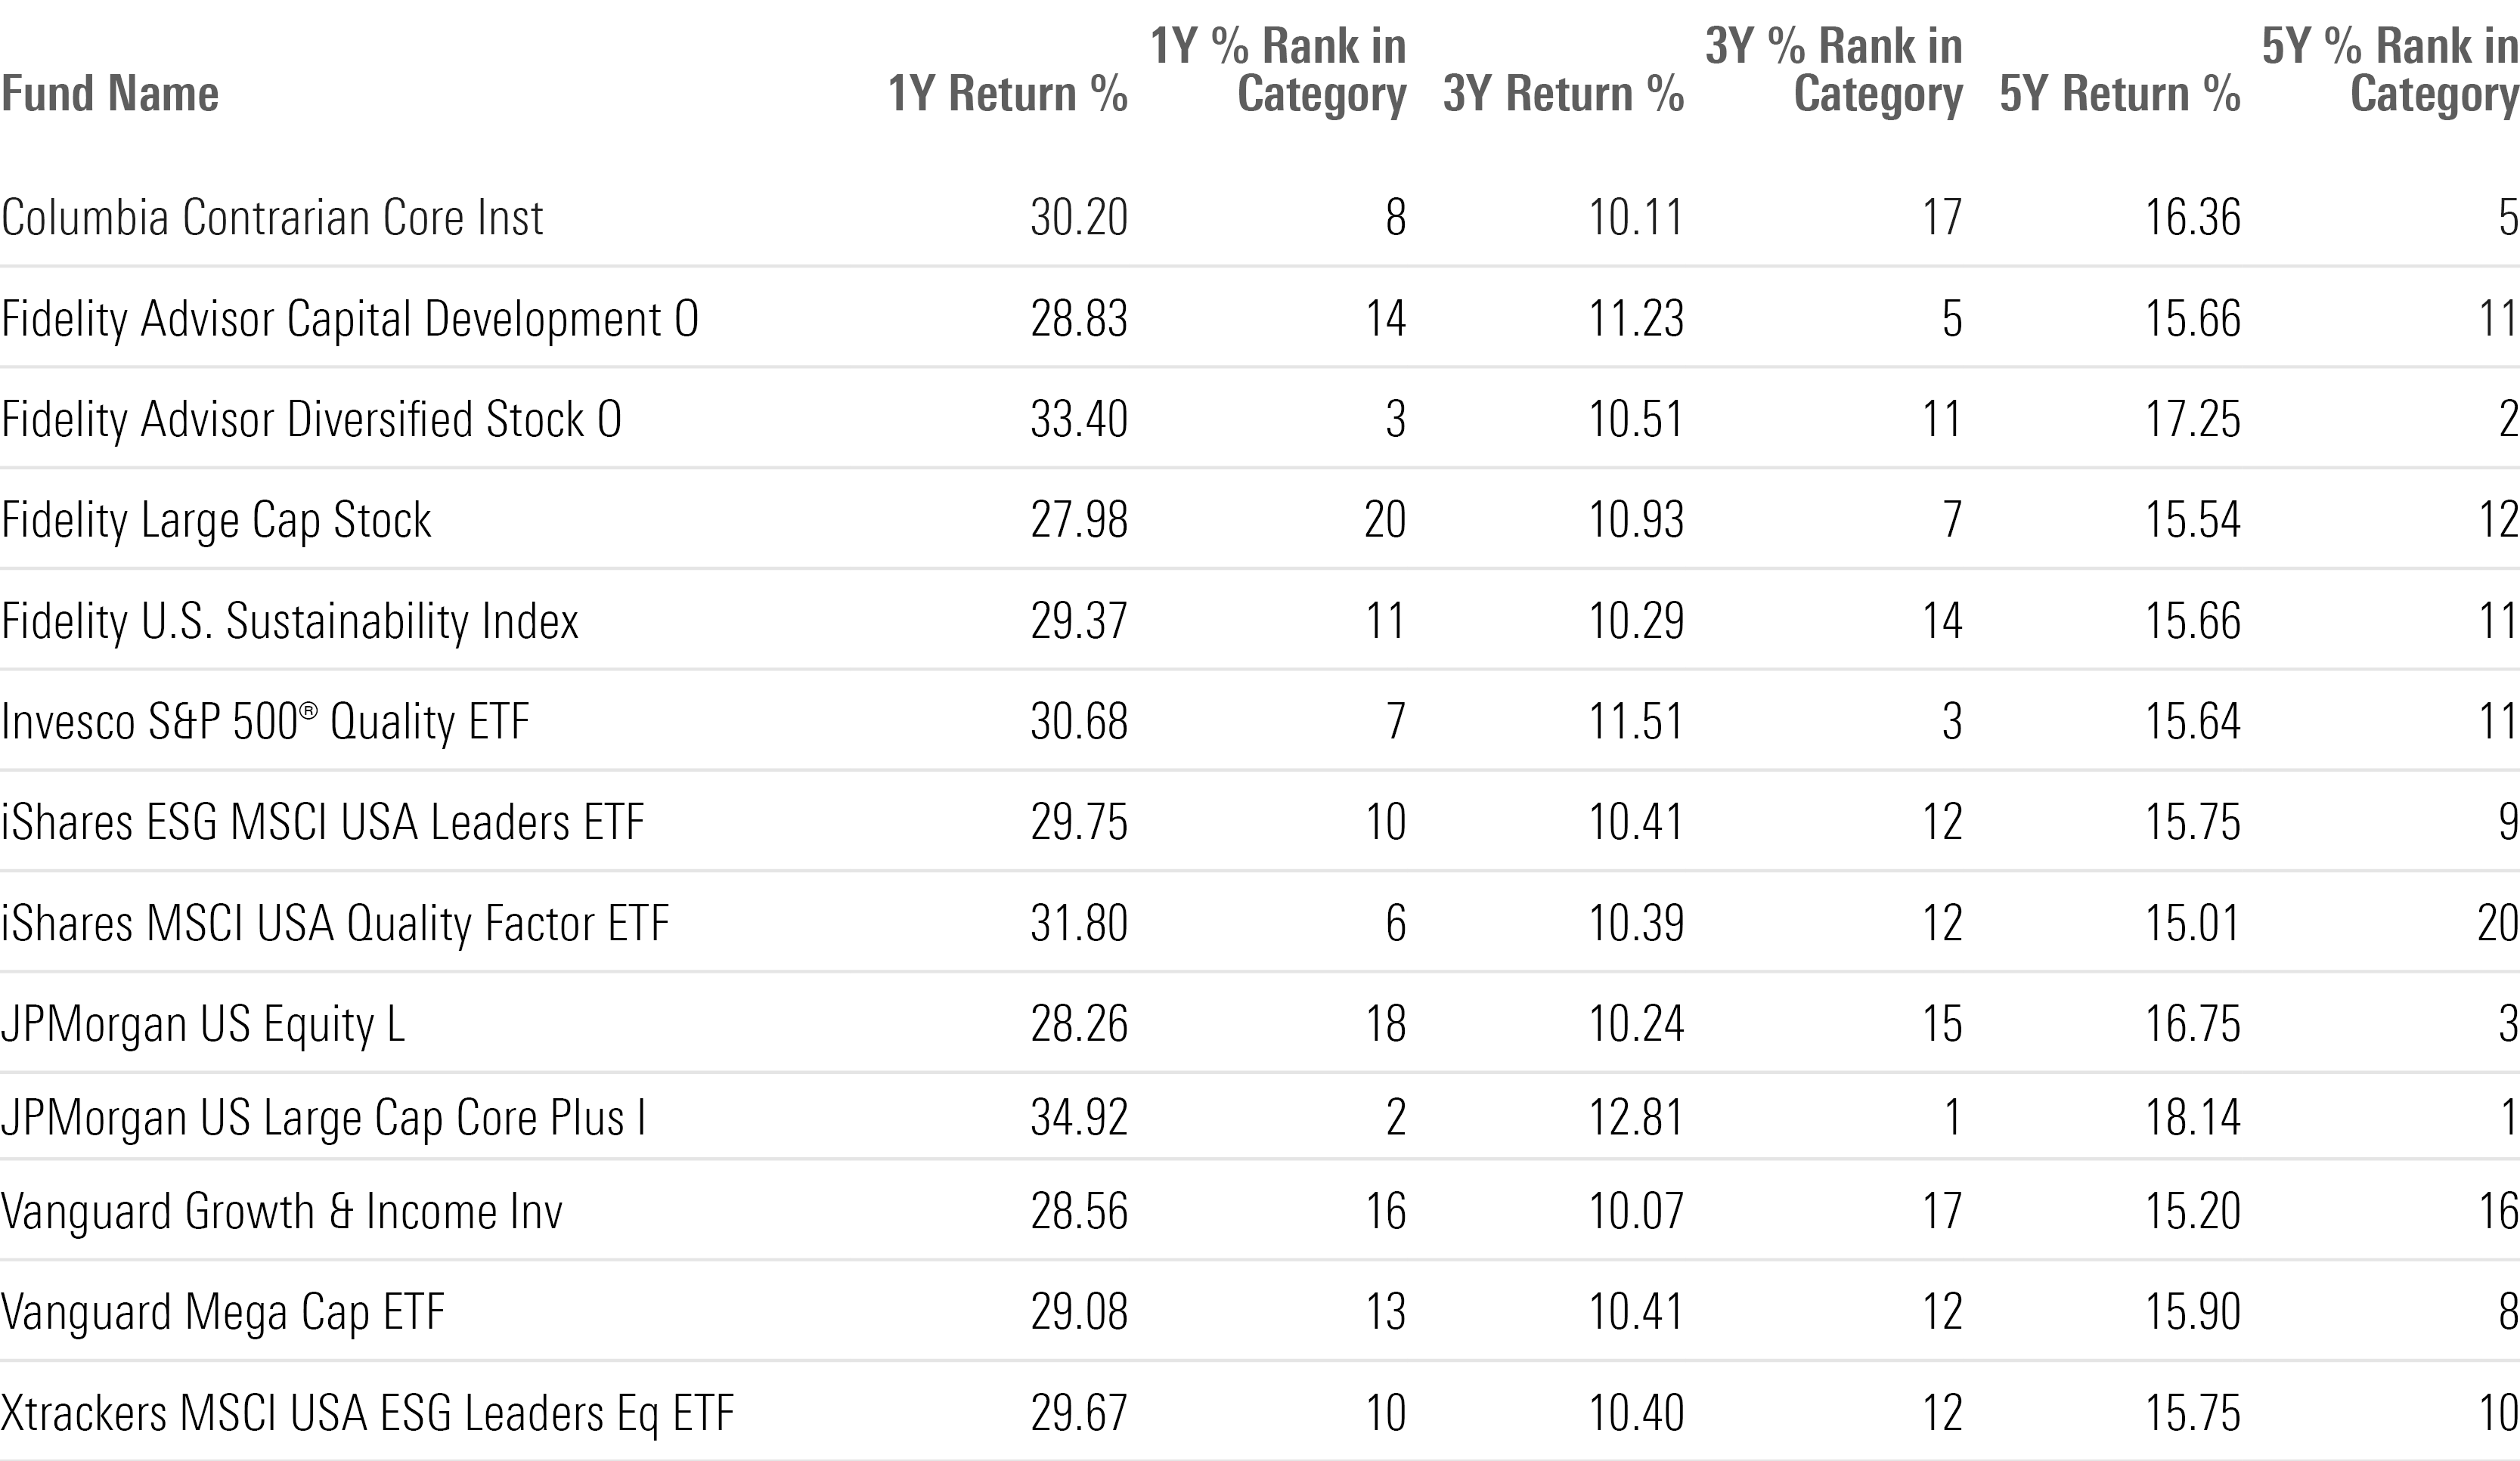
Long-Term Returns of Top-Performing Large-Blend Funds
This article was generated with the help of automation and reviewed by Morningstar editors. Learn more about Morningstar’s use of automation.
The author or authors do not own shares in any securities mentioned in this article. Find out about Morningstar’s editorial policies.
/cloudfront-us-east-1.images.arcpublishing.com/morningstar/ZKOY2ZAHLJVJJMCLXHIVFME56M.jpg)
/cloudfront-us-east-1.images.arcpublishing.com/morningstar/WJS7WXEWB5GVXMAD4CEAM5FE4A.png)
/cloudfront-us-east-1.images.arcpublishing.com/morningstar/AQETT7LOP5E2ZJBEHHEQLEHDQI.jpg)