
13 Charts on Q3′s Roller Coaster Rally for Stocks and Bonds
Stocks rebounded as the rotation from tech finally took hold and the Fed cut rates.
/s3.amazonaws.com/arc-authors/morningstar/84279ea2-135c-48d0-ab06-b618fe25a084.jpg)
/s3.amazonaws.com/arc-authors/morningstar/a8c4d0a1-24c6-4c96-81d6-7bb13a177a1e.jpg)

Investors were treated to a white-knuckle ride in the third quarter, but as the final three months of 2024 get underway, stocks are at record highs and bonds are solidly in the green.
The Federal Reserve’s long-awaited reduction in interest rates played a key role in the solid returns on stocks and bonds. But under the hood, there was a lot more going on with stocks than even the headline performance numbers might suggest.
The broad market rose throughout July, despite tech stocks running out of steam and turning lower. That cleared the way for value stocks and small caps to shine amid a long-awaited rotation, as investors shifted out of the rally’s winners and into the laggards. However, a brutal selloff in August, sparked by renewed fears of a recession and the sudden unwinding of big bets in Japan, saw stocks fall roughly 3% in one day. Equities have since clawed their way back into the green and ended the quarter up 6.06%, though concerns persist over an overvalued tech sector.
Underpinning the equity market’s rebound was the resolution of months of investor uncertainty over interest rates. With inflationary pressures easing, the Fed reduced its target rate by half a percentage point at its September meeting, and investors now expect the central bank to continue pushing rates lower at a fast clip. This additional clarity helped push bond markets further into positive territory during the quarter. Yields began falling in June and July as the outlook for rate cuts solidified.
Key Stats: Q3 2024 Stock and Bond Market Performance
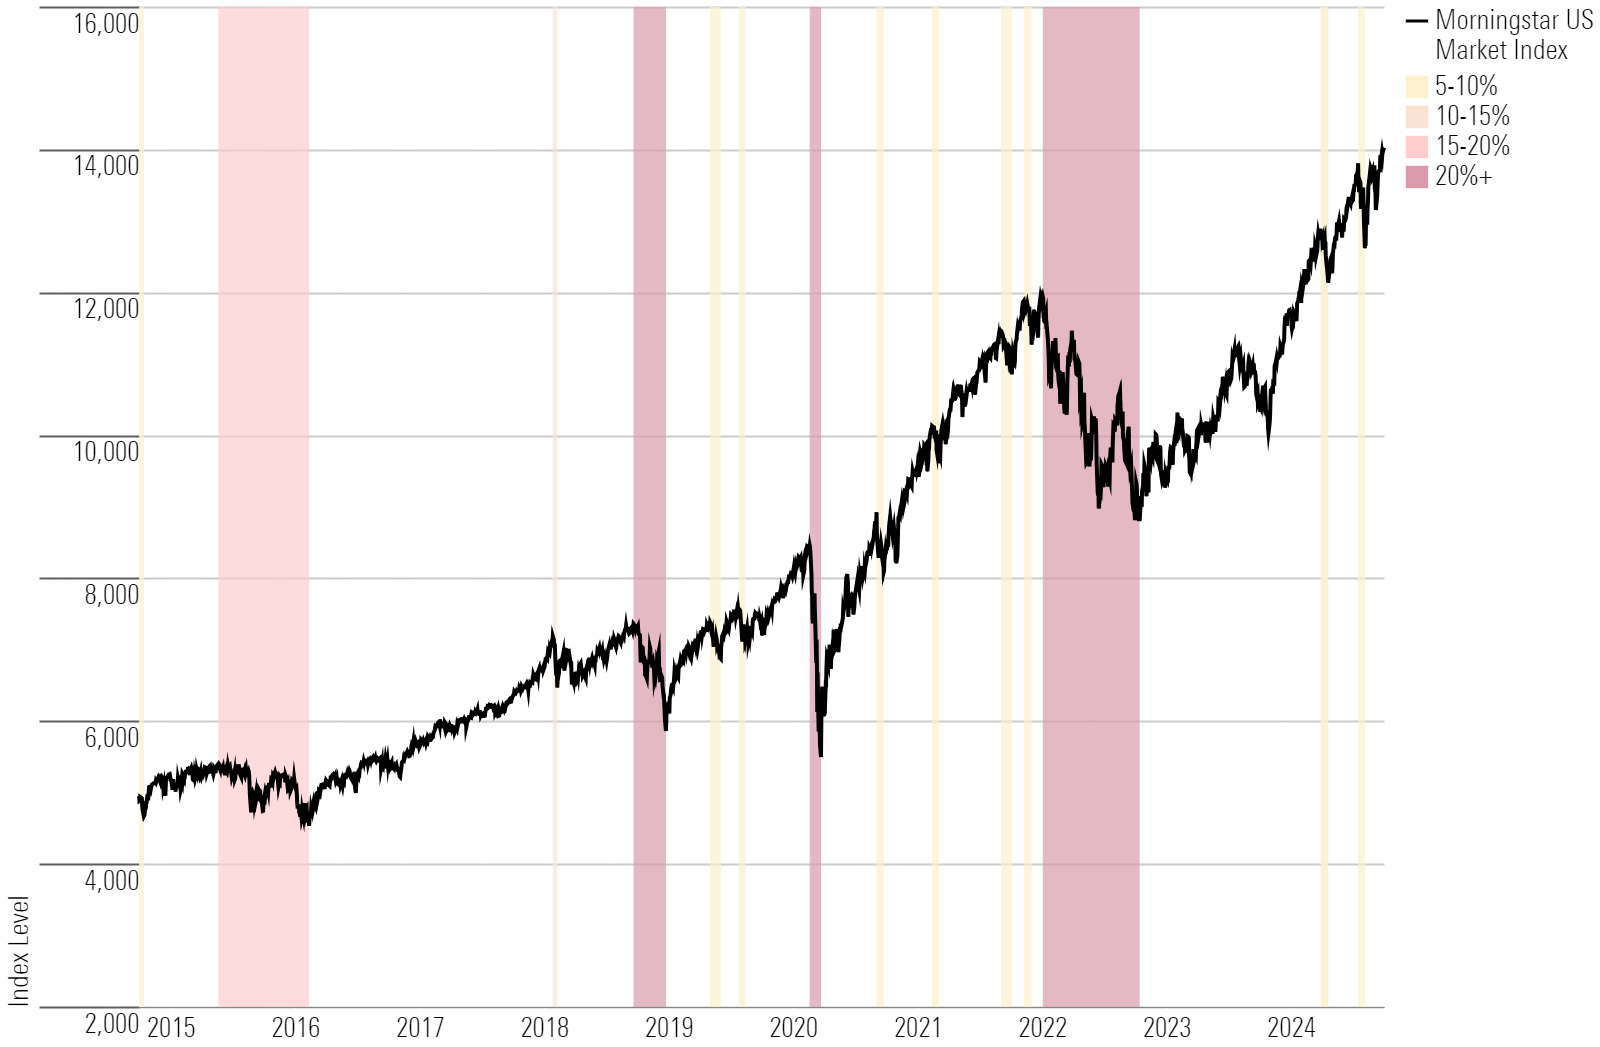
- The Morningstar US Market Index recovered from a selloff in August to end the third quarter up 6.06%, even as investors rotated away from mega-cap tech names. Stocks are up 35.6% over the past year.
- As tech stocks stumbled, investors looked to other areas. Value stocks gained 8.95% in the quarter, outperforming the broader market by nearly 3 percentage points. Meanwhile, growth stocks lagged.
- Bonds rallied as the outlook for interest rate cuts solidified. The Morningstar US Core Bond Index rose 5.15% as yields fell.
- Dividend stocks outperformed the broader market by nearly 3 percentage points, returning 8.89% for the quarter.
- With inflationary pressures fading, the Fed cut interest rates for the first time since 2020, bringing its target range for the federal funds rate to 4.75%-5.00%. Investors anticipate more cuts through the end of the year and into 2025.
- The yield curve un-inverted as bond yields fell.
- Oil prices fell 18.73%, which helped bring down overall inflation pressures. Meanwhile, gold prices rose more than 11%.
- Bitcoin ticked up roughly 5%, while ether plummeted more than 20%.
Q3 Stock Market Performance
The biggest stock market story in the third quarter was the beginning of a dramatic rotation out of technology stocks into corners of the market that had fallen by the wayside.
Starting in July, some of the mega-cap tech names underpinning the blistering rally of the past two years began to drag the market lower. Artificial intelligence darling Nvidia NVDA fell 1.69% in the quarter, while Microsoft MSFT lost 3.56% and Alphabet GOOGL/GOOG fell 8.84%. Analysts are still bullish on AI overall, but concerns about overly stretched valuations and the durability of an overly concentrated stock market weighed on these names.
The Morningstar Wide Moat Composite Index—which comprises stocks Morningstar analysts believe have a durable competitive advantage over their peers and counts Microsoft, Nvidia, and Amazon AMZN among its top holdings—underperformed the wider market in the quarter. Investors instead looked to small-cap and value stocks as a long-awaited broadening of the stock market rally began to materialize.
Stock Market Pullbacks
Value Stock vs. Growth Stock Performance
As tech stocks struggled, value stocks took the lead in the third quarter. The Morningstar US Value Index returned 8.95%, compared with just 4.63% for the Morningstar US Growth Index.
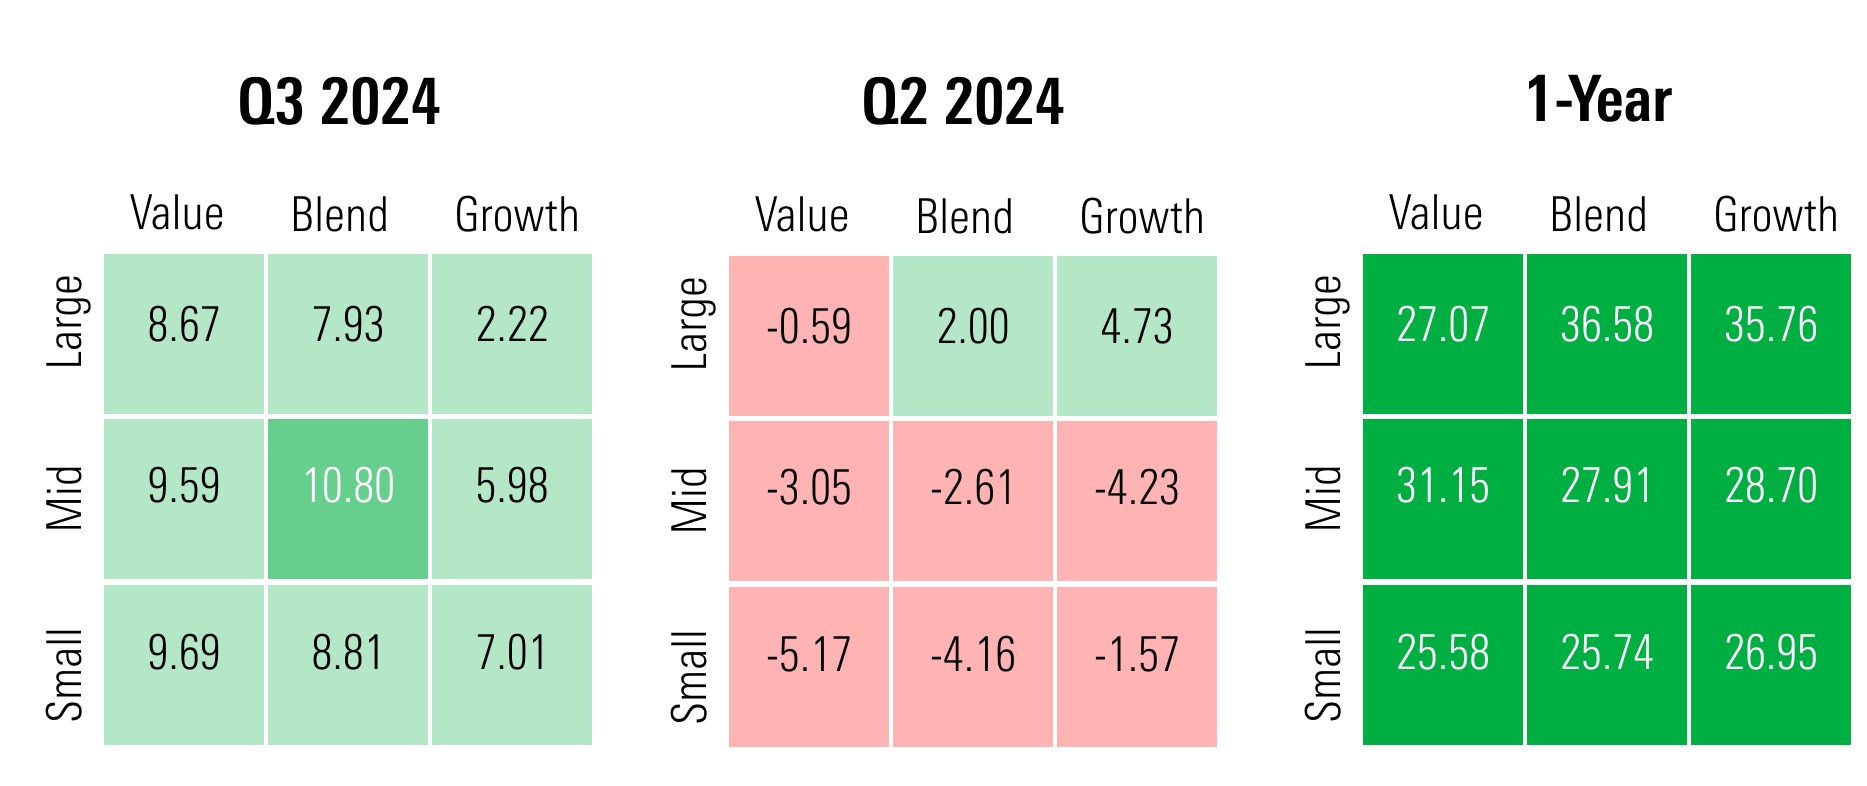
Within the style box, every category ended the quarter in the green. That’s a dramatic turnaround from the second quarter, when only large-blend and large-growth stocks saw gains. The largest returns came from mid-cap blend stocks, which soared 10.8%. Large-growth stocks fell to the back of the pack with returns of just 2.22%. Over the past year, however, the category remains dominant with returns of 35.76%.
US Equity Style Box Performance
Of the major stock sectors, utilities led the way in the quarter with gains of 19.81%. Close behind were real estate stocks, which returned 16.92%. Both utility and real estate stocks are sensitive to changes in interest rates, and they rallied as it became clear that the Fed would ease policy. Utilities also got a boost from expectations that the AI boom will translate into greater demand for electricity from new data centers.
Technology stocks returned just 2.35% for the quarter, but they’re still up 51.14% for the year. Communication services stocks performed similarly, ending the quarter up 1.79%. They’ve retained 12-month gains of 42.45%. The biggest losses came for energy stocks, which fell 2.83%.
Q3 Dividend Stock Performance
Dividend stocks outperformed the broader market for the first time in 2024. The Morningstar Dividend Composite Index returned 8.89%, while the Dividend Growth Index posted gains of 9.52%. The Dividend Leaders Index, which includes the 100 highest-yielding stocks from the Composite Index, returned 11.77% for the third quarter.
Strategists say investors can look to dividend stocks to generate reliable returns as interest rates fall, pointing to their defensive qualities as a benefit when the overall outlook for equities is less certain.
Federal Reserve Cuts Interest Rates
The Fed announced at its September meeting that it would reduce its target interest rate by half a percentage point, citing ongoing progress on inflation and attentiveness to a recent cooling of the labor market. The move ended months of investor speculation about the likely path of rates and brought about the end of an aggressive policy-tightening cycle that began in 2022 as inflation climbed to 40-year highs.
Investors had been expecting a cut of the same size in November, but are now looking for a smaller quarter-point easing, according to bond market data from the CME FedWatch Tool. Investors anticipate further cuts in 2025.
Treasury Yield and Federal-Funds Rate
Q3 Bond Market Performance
Bond markets continued to rally in the third quarter as the outlook for interest rates and the chances of a soft landing for the economy solidified. Yields on the 10-year Treasury note fell from 4.48% at the beginning of July to 3.75% by the end of the quarter.
Investors enjoyed some price appreciation as yields fell. The Morningstar US Core Bond Index gained 5.15% for the quarter and is now up 11.39% over the past 12 months. Investors found the most return in long-term core bonds and Treasury bonds.
Strategists expect shorter-term bond yields to keep falling as the Fed cuts interest rates, but they don’t see as much upside for longer-term ones, since expectations for a soft landing are largely priced into bond markets.
The Treasury Yield Curve Un-Inverts
The beginning of a Fed easing cycle also normalized the yield curve—a graphical representation of bond yields across different maturities. After more than two years of inversion (wherein short-term yields were higher than long-term yields), yields on short-term bonds fell below those on long-term bonds in early September. This is how yields generally behave, and the upward-sloping curve reflects the extra income that investors demand in exchange for locking up their money with the government.
Against that backdrop, strategists encourage investors to move out of cash and shorter-dated bonds to capture higher yields on intermediate-dated products—those with maturities roughly between three and seven years. They’re also warning of the potential for an uptick in volatility in very long-dated bonds, which are sensitive to changes in economic expectations.
U.S. Treasury Yield Curves
Stock and Bond Market Volatility
Volatility in the stock market ticked up slightly in the third quarter, but again remained low compared to historical trends in the United States. Volatility in developed markets, emerging markets, and the US bond market came in near the five-year average.
Q3′s Best and Worst Performers
Some of the best performance across global markets in the third quarter came from real estate investment trusts, with the Morningstar Canada REIT Index returning 24.62% and the Morningstar Australia REIT Index returning 23.26%. REITS are relatively sensitive to interest rates. They tend to outperform when rates fall, and they attract investors searching for yield when other assets underperform.
Semiconductor stocks, on the other hand, have seen a major reversal of fortune as big tech continues to struggle. The Morningstar Global Semiconductor Equipment and Materials Index (which includes 101 global companies involved in the design, development, and manufacture of semiconductors and their related equipment) plunged 16% in the quarter.
Commodity Market Performance
West Texas Intermediate crude oil prices fell 18.73% in the third quarter amid increased production and waning demand from China. That followed a small loss in the second quarter and marked a major turnaround from the first, which saw prices rise more than 18%. Falling oil prices generally push down prices for gasoline and other consumer goods, which has been a major contributor to disinflation over the past few months.
Meanwhile, gold prices climbed more than 11% in the third quarter as investors searched for safety during volatile months in the stock market.
Copper, which is used across a wide range of industrial processes and products, saw prices roughly 1% for the quarter, also on concerns about waning demand for industrial materials in China.
Commodity Futures Performance
Q3 Cryptocurrency Performance
After posting dramatic gains early in the year after the approval of its first spot ETFs, bitcoin, the largest cryptocurrency, floundered in the third quarter, returning 5.24%.
Meanwhile, ether posted losses of more than 20% as investors sought safe havens elsewhere and interest cooled after the launch of Ethereum ETFs.
Cryptocurrency Performance
The author or authors do not own shares in any securities mentioned in this article. Find out about Morningstar’s editorial policies.
/d10o6nnig0wrdw.cloudfront.net/09-30-2024/t_61f731056f0e43608b734624542f1bd2_name_file_960x540_1600_v4_.jpg)
/cloudfront-us-east-1.images.arcpublishing.com/morningstar/PNCGQ5M56VGC5PJRBI7FPQIR7E.png)
/cloudfront-us-east-1.images.arcpublishing.com/morningstar/6JNXNDYK3RH73MZK3IZ6UTSIAY.png)
:quality(80)/s3.amazonaws.com/arc-authors/morningstar/84279ea2-135c-48d0-ab06-b618fe25a084.jpg)
:quality(80)/s3.amazonaws.com/arc-authors/morningstar/a8c4d0a1-24c6-4c96-81d6-7bb13a177a1e.jpg)