
Considering Private Equity? Think Twice Before Investing in Business Development Companies
BDCs offer investors a way into private equity, and they’re hard to recommend.
/s3.amazonaws.com/arc-authors/morningstar/8c5d95ea-6364-418e-82fc-473134024ece.jpg)

Since the global financial crisis of 2007-09, the size of the private credit market has grown dramatically and now exceeds $1 trillion. Antti Suhonen, author of the study “Direct Lending Returns,” published in the Financial Analysts Journal, examined the returns, risk exposures, and performance persistence of business development companies. BDCs, created by congressional legislation, are closed-end investment vehicles organized under the Investment Company Act of 1940. They have the following characteristics:
- They generally invest in small and midsize companies through debt and, to a lesser extent, equity securities and derivative securities.
- They are required to invest at least 70% of their assets in nonpublic equity and debt of US corporations.
- Eligible investments also include US government securities, cash, and listed securities of companies with a market capitalization of less than $250 million.
- BDC investment holdings are subject to diversification requirements.
- Senior secured loans form the majority of BDC portfolio assets today, though they may also hold subordinated debt as well as equity warrants and direct equity ownership in their portfolio companies.
- BDCs are permitted to use up to 200% leverage. Virtually all BDCs take advantage of a full turn (100%) of leverage. The use of leverage increases risk and drawdowns while also increasing expected returns.
- 90% of a BDC’s income must be derived from dividends and interest, and 90% must be distributed to shareholders.
- Managers are typically compensated through a combination of fixed and incentive-based management fees (percentage of net interest income and realized gains).
- BDCs are not allowed to issue shares to the public below net asset value without annual shareholder approval.
BDCs: Risky and Expensive
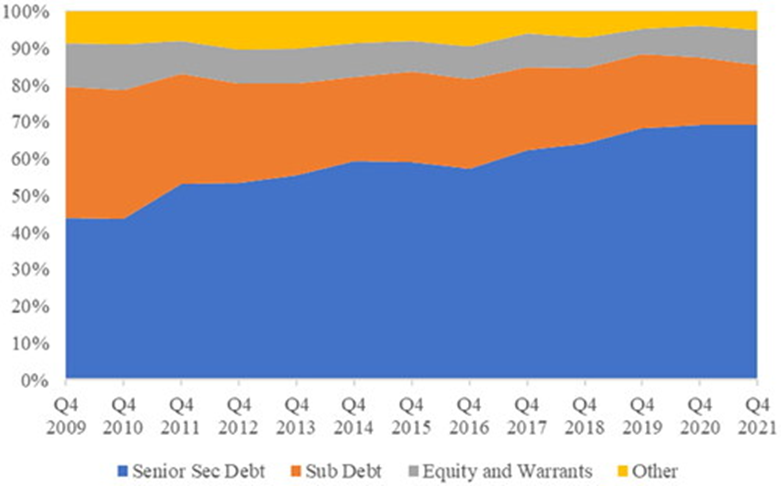
Suhonen’s database consisted of 47 BDCs (with about $112 billion of assets at the end of 2021) and covered the period of December 2009 through June 2022. The following chart shows the market-capitalization-weighted asset allocation of the 47 BDCs in the sample.
Market-Cap-Weighted Asset Allocation of 47 BDCs in Study
Following is a summary of Suhonen’s key findings:
- BDC portfolio yield averaged 10.8% over the sample period (or average USD three-month Libor plus 10%). The yield compressed by 4 percentage points, from a high of 12.8% in 2012 to 8.6% in first-quarter 2022, before the widening in the final quarter of the sample. The compression is likely in part a reflection of the improvement in BDC loan seniority (see chart). The average BDC yield spread over leveraged loans during the sample period was 5.7%, ranging between 0.9% and 7.9%.
- Since 2019, the debt/equity ratio has averaged 102% versus 61% in 2009-17. The increase in leverage is due to congressional action taken in 2019 that raised the leverage limit to 2.0 from 1.0.
- The average annual management fee expense (including incentive fees) over the sample period was 3.19% of total assets, corresponding to 5.46% of net assets. This compares with an average management fee of 3.14% per year of net assets for private direct lending funds.
- The average financing expense was 4.36% per year of total debt, or three-month Libor plus 3.58% given an average Libor rate of 0.78% during the period.
- BDC industry total returns at the market-capitalization-weighted index level were 8.63% per year with a Sharpe ratio of 0.38. The Sharpe ratio was well below that of comparable benchmarks such as leveraged loans (0.61) and high-yield bonds (0.63).
- BDC market value returns were best explained by a combination of liquid leveraged loan performance and equity market, size, and value factors.
- Bundling the equity factors into one by using an equity small-cap value index as an explanatory variable alongside leveraged loans, the two regressors explained 81% of BDC market value index variation in monthly data and resulted in a negative but statistically insignificant alpha.
- BDCs’ volatility was broadly in line with that of small-cap equities. However, their returns exhibited more negative skewness and excess kurtosis than the equity benchmarks, though less than the leveraged loan index.
- Individual BDCs exhibited wide performance dispersion, with the difference between top- and bottom-quartile returns in excess of 15% per year across different performance measures.
- Based on an NAV return metric, BDC performance exhibited strong year-on-year persistence, especially in the bottom and top quartiles of past returns.
- There was a statistically significant relationship between valuation (price/NAV) and performance, with BDCs with greater price/NAV premium (or smaller discount) outperforming those with a smaller premium (larger discount) by all return metrics.*
Investor Takeaways
Once traded in the listed market, BDCs adopt the volatility of common stocks and may deviate from their fundamental value because of changes in investor risk aversion and market liquidity. The result is that they are riskier than the assets they hold, a problem compounded by their use of high amounts of leverage. Add to that their extremely high fees relative to net investor assets (in excess of 5%), and it is hard to make a case for investing in public BDCs, especially when there are less risky and less expensive alternatives, such as Cliffwater Corporate Lending Fund CCLFX and Cliffwater Enhanced Lending Fund CELFX. The high expense ratio is particularly egregious when it is applied to gross assets (as opposed to net assets). The reason is that gross assets include those that are financed with leverage that has had an average cost of about 3.6% above Libor. The result is that the investor is paying full fees on the leveraged assets when they are not earning the full yield paid by the borrower. In contrast, Cliffwater’s fees are applied to net assets.
*When I discussed this finding with Cliffwater’s CEO, Stephen Nesbitt, he informed me that, while the finding was correct for a buy-and-hold strategy, his research found that a periodic rebalancing strategy from high price/book to low price/book produced higher returns than a buy-and-hold strategy.
Larry Swedroe is head of financial and economic research for Buckingham Wealth Partners, collectively Buckingham Strategic Wealth, LLC and Buckingham Strategic Partners, LLC.
For educational and informational purposes only and should not be construed as specific investment, accounting, legal, or tax advice. Certain information is based on third party data and may become outdated or otherwise superseded without notice. Mentions of specific securities are for educational purposes only and are not recommendations of implementing them into a portfolio. Individuals should speak with a qualified financial professional based on their circumstances. Neither the Securities and Exchange Commission (SEC) nor any other federal or state agency have approved, determined the accuracy, or confirmed the adequacy of this article. The opinions expressed here are their own and may not accurately reflect those of Buckingham Strategic Wealth, LLC or Buckingham Strategic Partners, LLC, collectively Buckingham Wealth Partners. LSR-24-627
Larry Swedroe is a freelance writer. The opinions expressed here are the author’s. Morningstar values diversity of thought and publishes a broad range of viewpoints.
The author or authors do not own shares in any securities mentioned in this article. Find out about Morningstar’s editorial policies.
/cloudfront-us-east-1.images.arcpublishing.com/morningstar/HCVXKY35QNVZ4AHAWI2N4JWONA.png)
/cloudfront-us-east-1.images.arcpublishing.com/morningstar/EC7LK4HAG4BRKAYRRDWZ2NF3TY.jpg)
/cloudfront-us-east-1.images.arcpublishing.com/morningstar/ZJTW7PDXFVDWDP7YNYC4UVOHVU.jpg)
:quality(80)/s3.amazonaws.com/arc-authors/morningstar/8c5d95ea-6364-418e-82fc-473134024ece.jpg)