
13 Charts On the Market’s Q2 Turnaround
Amid more progress on inflation, rate cuts are finally coming into view.


Markets rewarded patient investors in the second quarter.
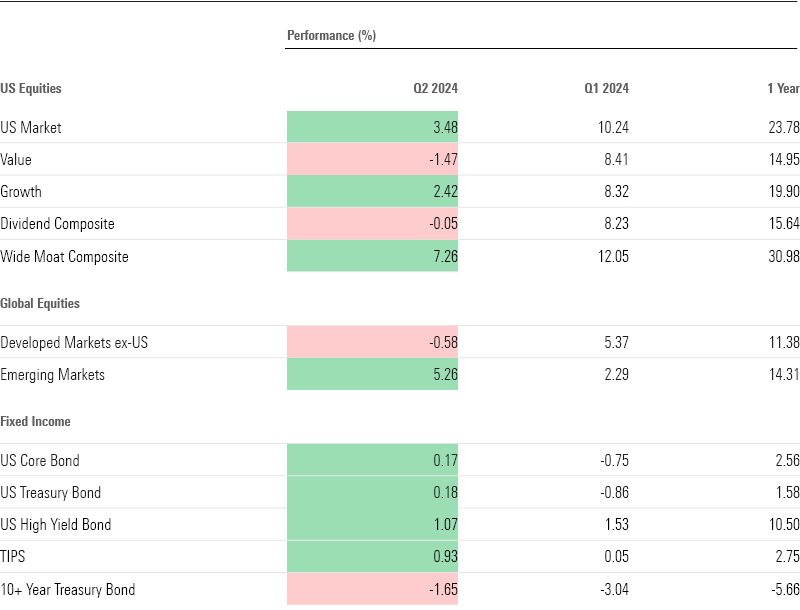
Stubbornly high inflation sent stocks falling in April, amid worries that the Federal Reserve would be forced to keep interest rates higher for longer than previously expected. Even as the Fed has signaled just one rate cut is in the cards—down from three at the start of the quarter—stocks roared back to finish the quarter in the green, thanks to improving inflation data and strong first-quarter earnings. The US Market Index rose 3.48% in the second quarter and is now up 23.78% over the past 12 months.
Under the hood, the artificial intelligence trade showed no signs of slowing in the quarter, and tech stocks continued to dominate. Bond markets also ended the quarter in positive territory, as investors gained confidence that inflation was improving. That lowered yields and added some price appreciation back to bondholders’ portfolios.
US Stock Market Performance
Key Stats: Q2 2024 Stock and Bond Market Performance
- The US Market Index gained 3.48% in the second quarter, recovering from a major pullback in April. Stocks are up 23.78% over the past 12 months.
- Megacap tech stocks continued to drive market gains, with Nvidia NVDA alone contributing 1.6 percentage points of the market’s returns. A highly anticipated broadening of the rally to other sectors did not materialize.
- Value stocks once again lagged their larger growth counterparts.
- Bonds ended the second quarter narrowly in the green, with the US Core Bond Index up 0.17%. Yields fell.
- Dividend stocks lagged the broader market, and Alphabet GOOGL/GOOG was the latest tech giant to announce its first-ever dividend payment.
- The Fed held interest rates steady. Markets now anticipate a September cut.
- The yield curve remained inverted.
- Oil prices fell, which helped bring down inflation. Meanwhile, copper prices soared 8.51%.
- Bitcoin lost momentum after a record-breaking first quarter.
Quarterly Market Performance Barometer
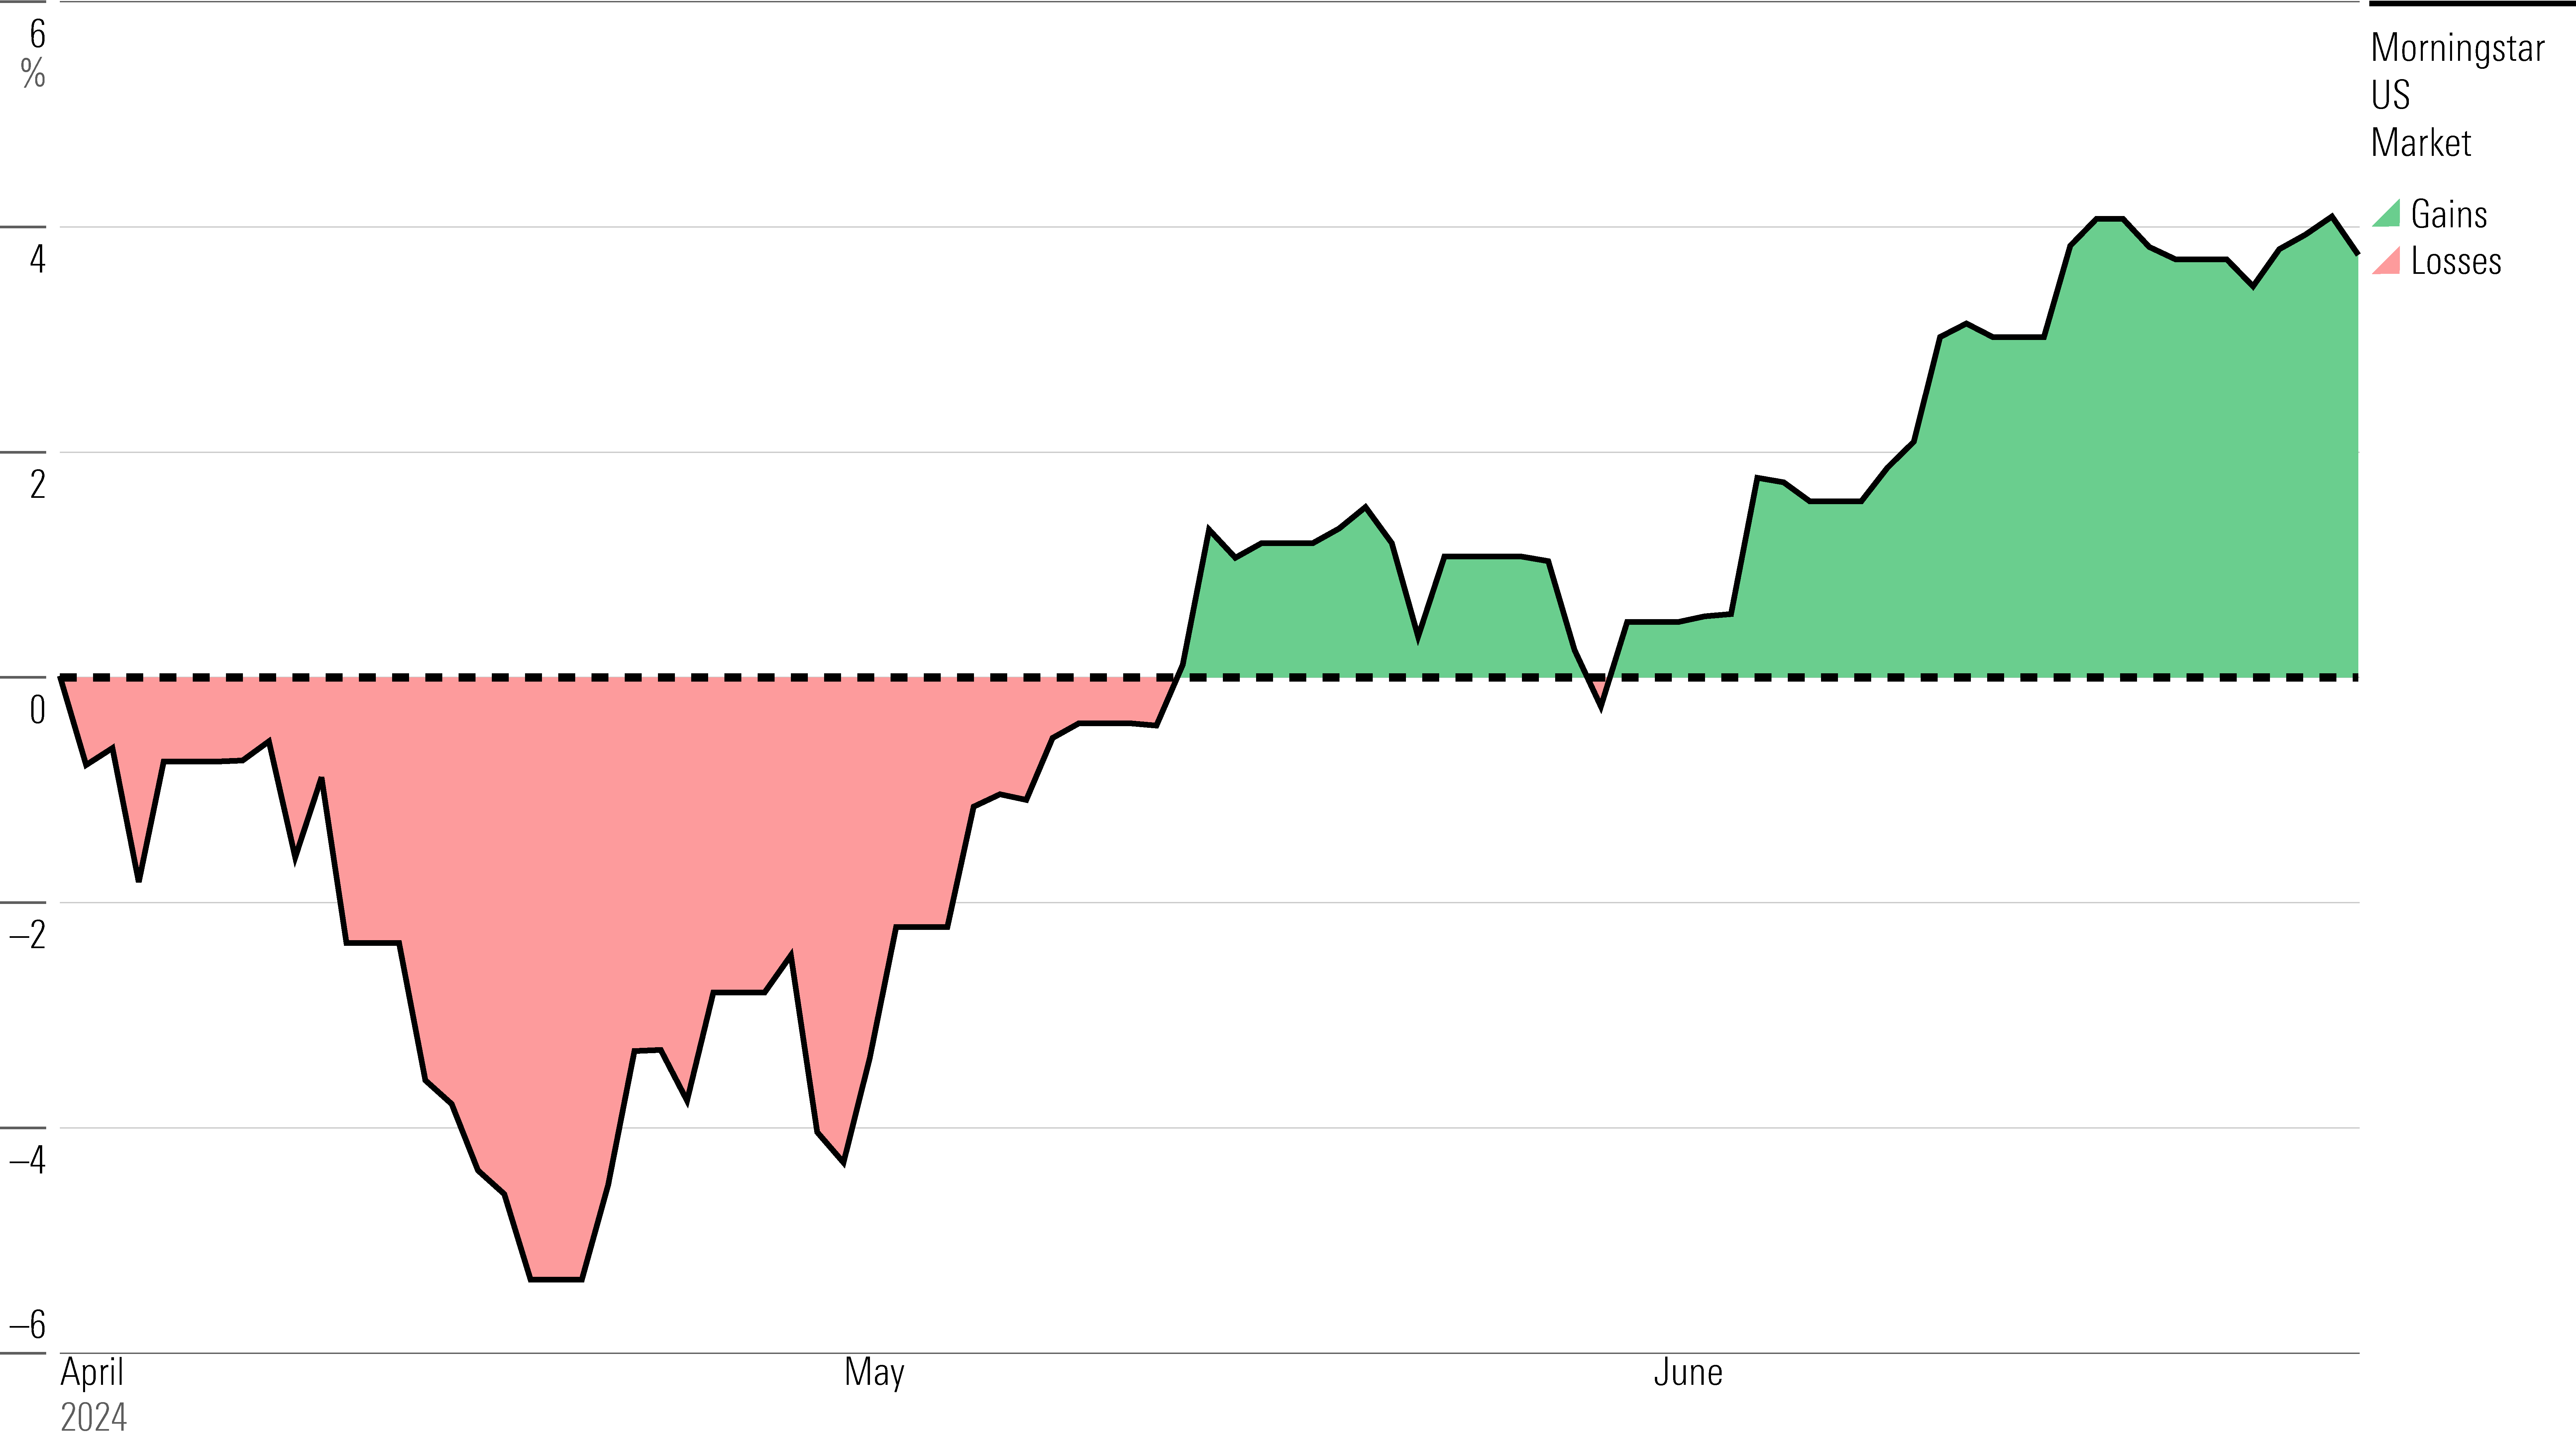
Stock Market Performance
Markets had a tough start to the quarter. April brought a major pullback, with stocks falling 5.6% from their March highs. The momentum changed in the middle of the month, following a strong jobs report, and stocks were back in the green by the middle of May. The gains continued, and the stock market ended the quarter up 3.48%.
As in the first quarter, chipmaker Nvidia led the way. The AI giant gained 36.74% and is now up 200% over the past year. Nvidia alone contributed 1.6 percentage points to the market’s return in the quarter.
The next-largest contributors were Apple AAPL, Microsoft MSFT, and Alphabet—a sign that the bull market’s long-awaited expansion beyond big tech has failed to materialize. So far, strategists say these companies are living up to investors’ expectations for earnings and performance, but they warn that with valuations stretched, any misstep could send these stocks tumbling.
The Wide Moat Composite Index returned 7.26%, beating the US market by more than 5 percentage points. The index consists of stocks Morningstar analysts believe have a long-lasting competitive advantage over their peers. Its top holdings are Microsoft, Apple, Nvidia, and Amazon AMZN—the same stocks driving the market’s blistering rally.
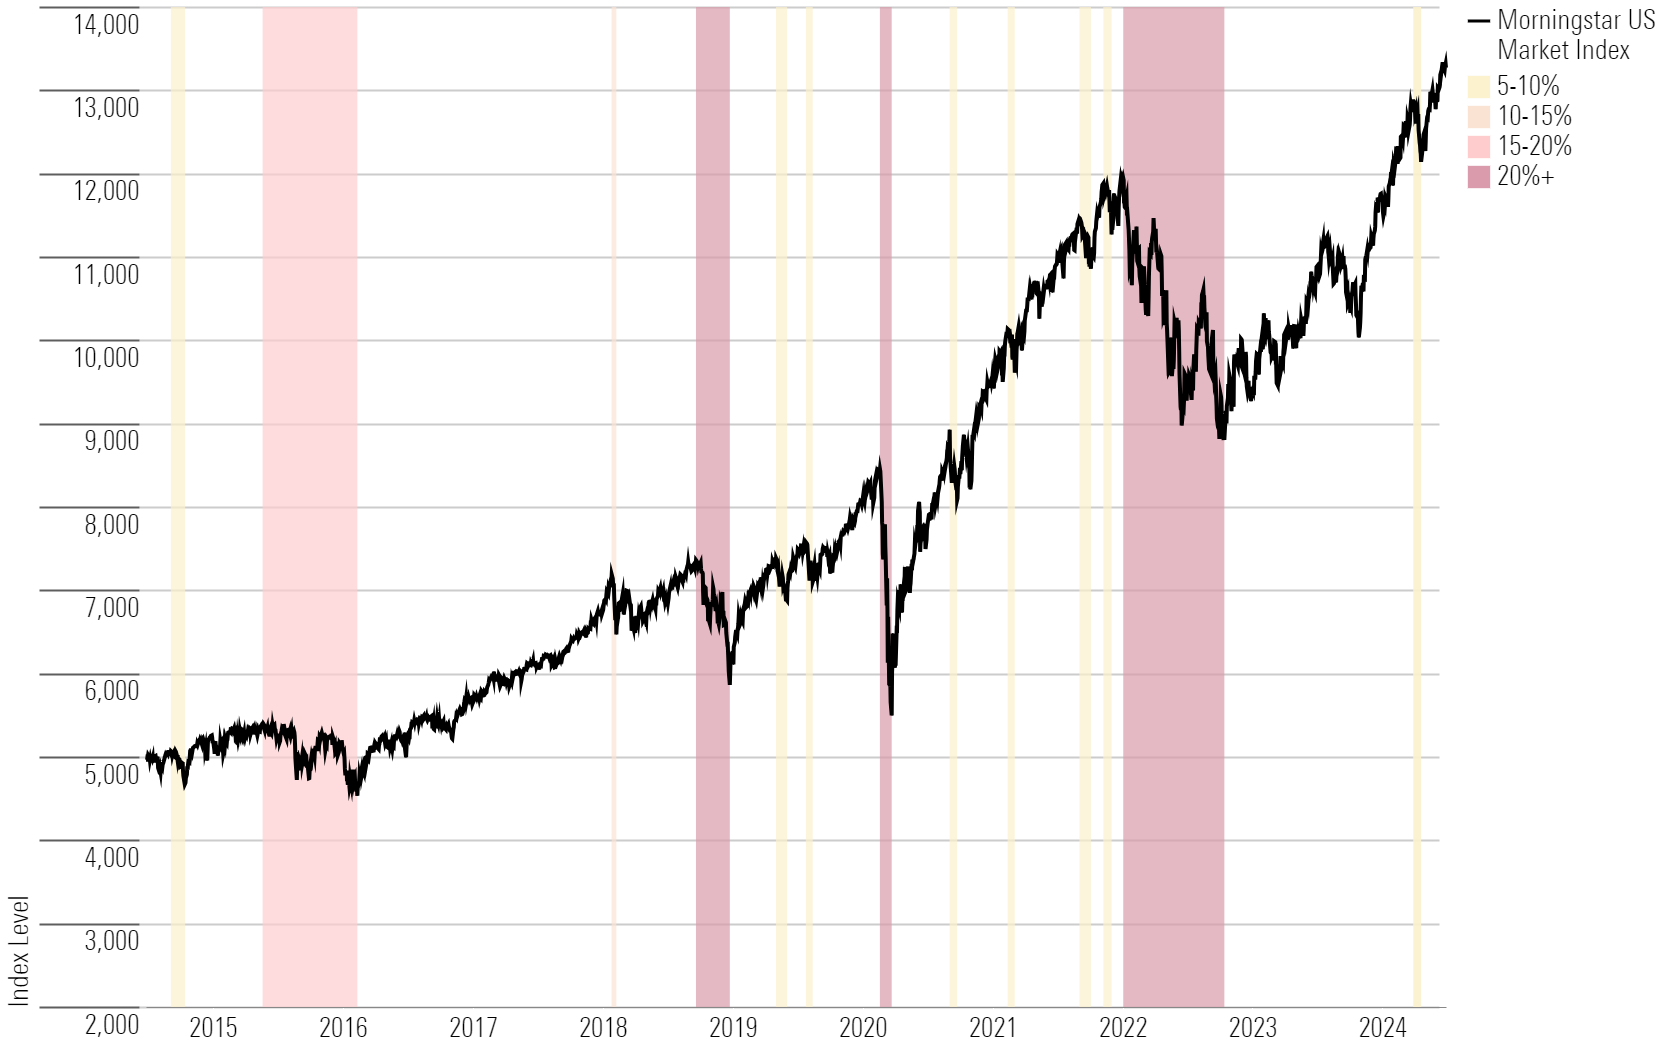
Stock Market Pullbacks
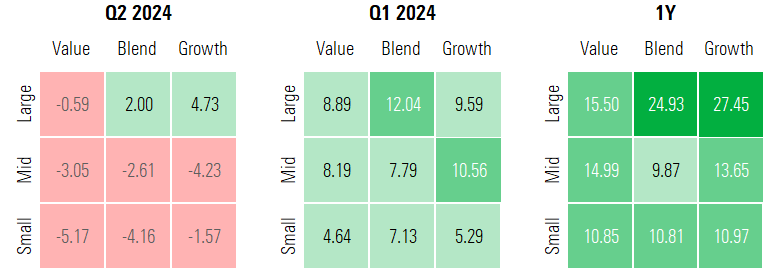
Value Stock vs. Growth Stock Performance
After narrowly beating out growth stocks in the first quarter, value stocks lagged in the second. The US Value Index fell 1.47%, compared with a 2.42% gain for the US Growth Index.
Reflecting the narrow reach of the rally, within the style box, only large-growth and large-blend stocks rose. The biggest losses came from small-cap value stocks, which plunged 5.17%. However, over the past 12 months, every category is still in the green.
US Equity Style Box Performance
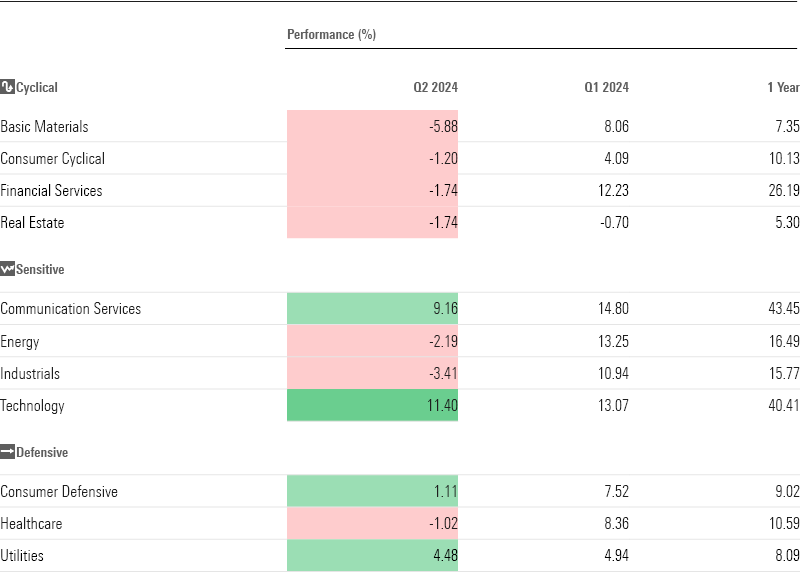
Technology and communications stocks continued to lead the market higher in the quarter. Tech stocks climbed 11.40%, while communication stocks saw gains of 9.16%. Defensive stocks were another bright spot, with consumer defensives up 1.11% and utilities up 4.48%. Cyclical stocks fell across the board, with the biggest losses coming among basic materials. Energy and industrial stocks plummeted after posting double-digit gains in the first quarter. With interest rates staying high, real estate stocks continued to struggle.
Stock Sector Performance
Dividend Stock Performance
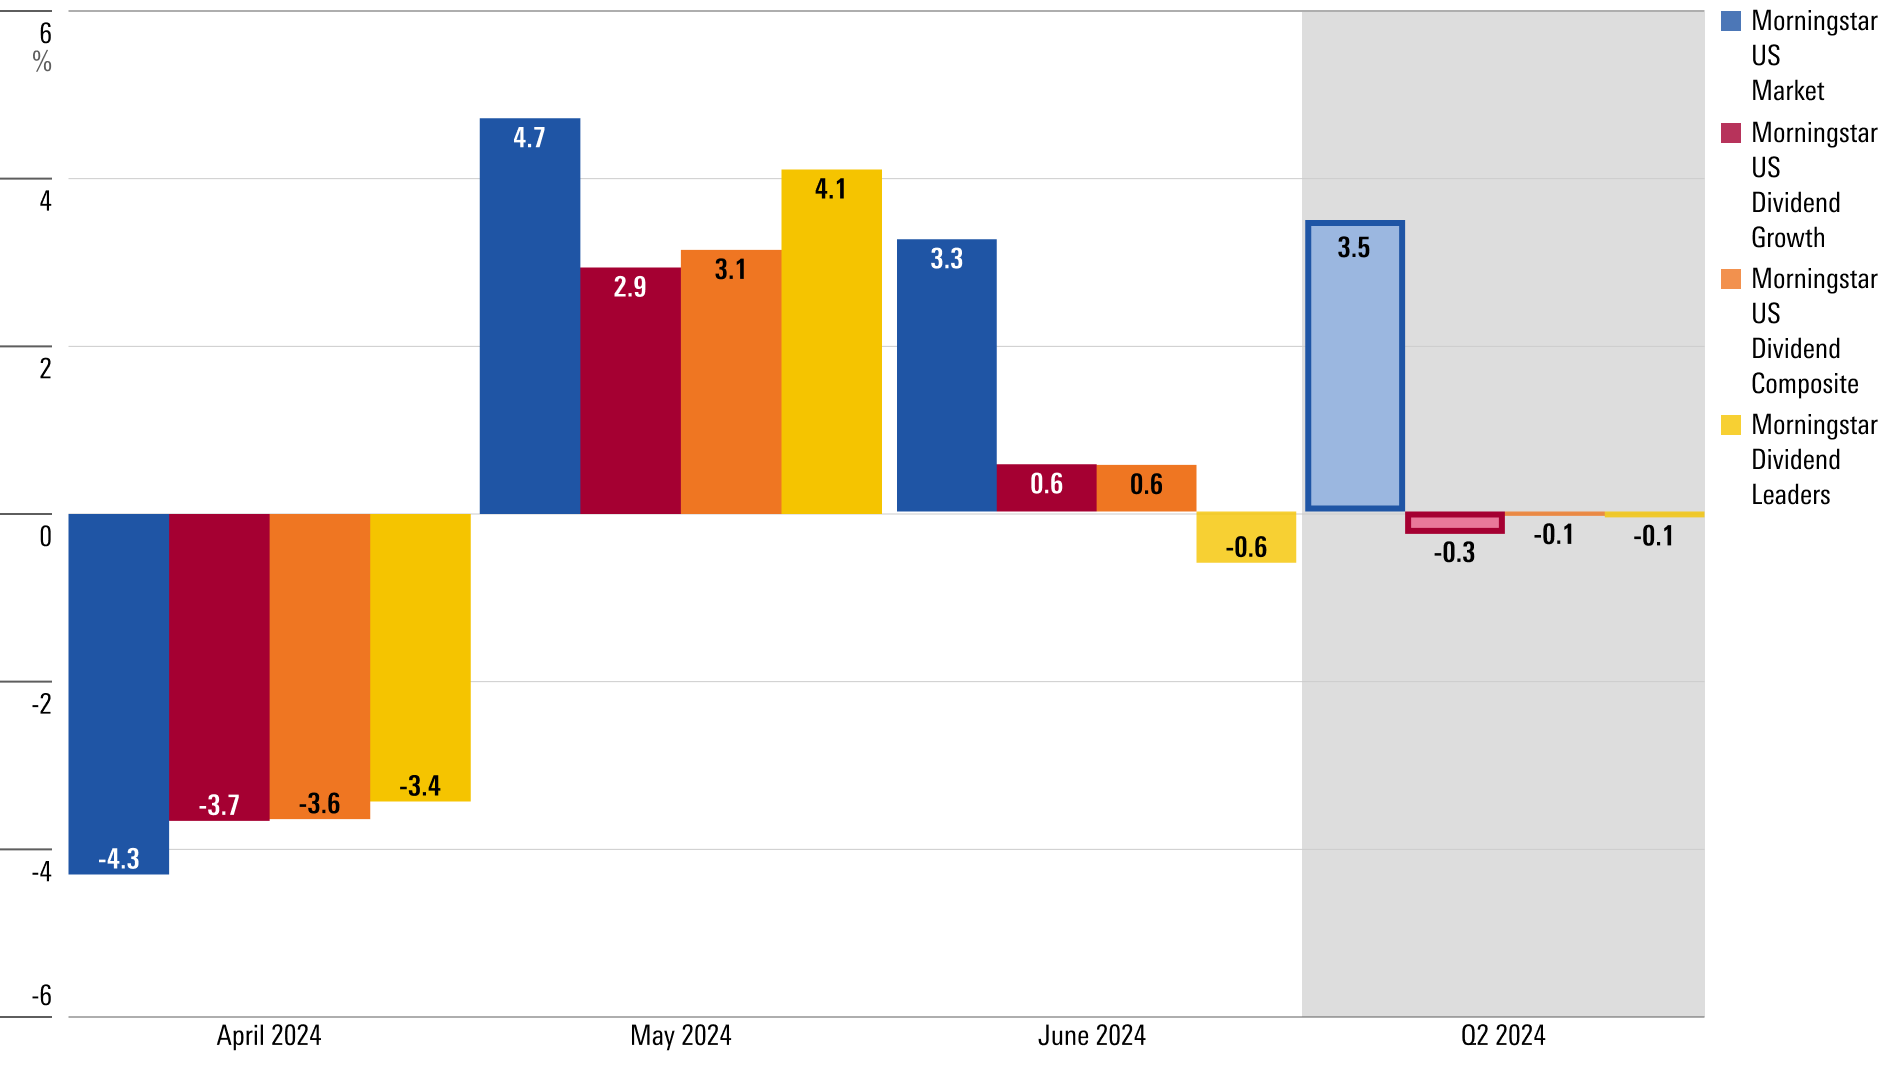
Dividend stocks continued to lag the broader market in the second quarter. The Dividend Composite Index ended the quarter down 0.1%, unable to overcome its April losses despite posting gains in May and June. The US Dividend Growth Index fell 0.3% while the Dividend Leaders Index fell 0.1%.
Alphabet announced its first-ever dividend payout in April, joining a growing cohort of dividend-paying tech stocks that includes Meta Platforms META and Salesforce CRM. Strategists believe these mega-cap tech stocks have the potential to grow their dividends over time, but caution that yields remain relatively low for now.
Morningstar Dividend Indexes vs. the US Market
Markets Price In September Interest Rate Cut
Market expectations for the Federal Reserve’s next move have changed dramatically in 2024. The Fed has kept interest rates steady at a target range of 5.25%-5.50% for nearly two years, and investors have been anxiously watching for evidence that rate cuts could be around the corner.
Bond futures markets started the year pricing in six or seven cuts in 2024, but stronger-than-expected inflation data forced investors to dramatically revise that estimate. Now markets are anticipating just one or two cuts this year. They see a roughly 58% chance of a 0.25-percentage-point reduction at the Fed’s September meeting, according to the CME FedWatch tool.
Treasury Yield and Federal-Funds Rate
Q2 2024 Bond Market Performance
Bond markets recovered in the second quarter, boosted by improving inflation and a firmer, more confident outlook for rate cuts. Yields on the 10-year Treasury note have fallen more than 0.30 percentage points from their April peak, ending the quarter at 4.37%.
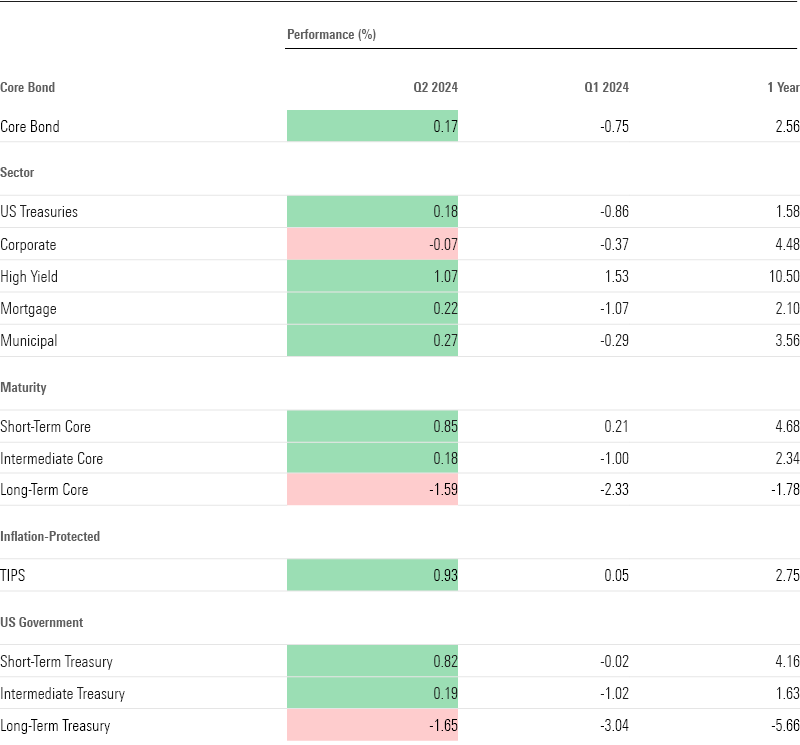
That drop in yields has meant investors have seen some price appreciation on their bond holdings. The Core Bond Index gained 0.17% for the quarter, roughly in line with the 0.18% return on US Treasury bonds. High-yield bonds saw larger gains of 1.07%, while longer-term yields lagged. With rate cuts on the horizon, strategists expect bonds to continue outperforming.
Morningstar Bond Indexes
The Treasury Yield Curve Is Still Inverted
The yield curve remained inverted in the second quarter, with yields almost exactly in line with March at quarter-end, despite a bumpy few months in the bond market.
An inverted yield curve means short-term Treasuries yield more than their long-term counterparts. It’s often taken as a sign that investors expect the economy to perform poorly in the months ahead. It’s also generally a precursor to a recession, though not a guarantee. The yield curve has now been inverted for nearly seven consecutive quarters—an unusually long time.
US Treasury Yield Curves
Stock and Bond Market Volatility
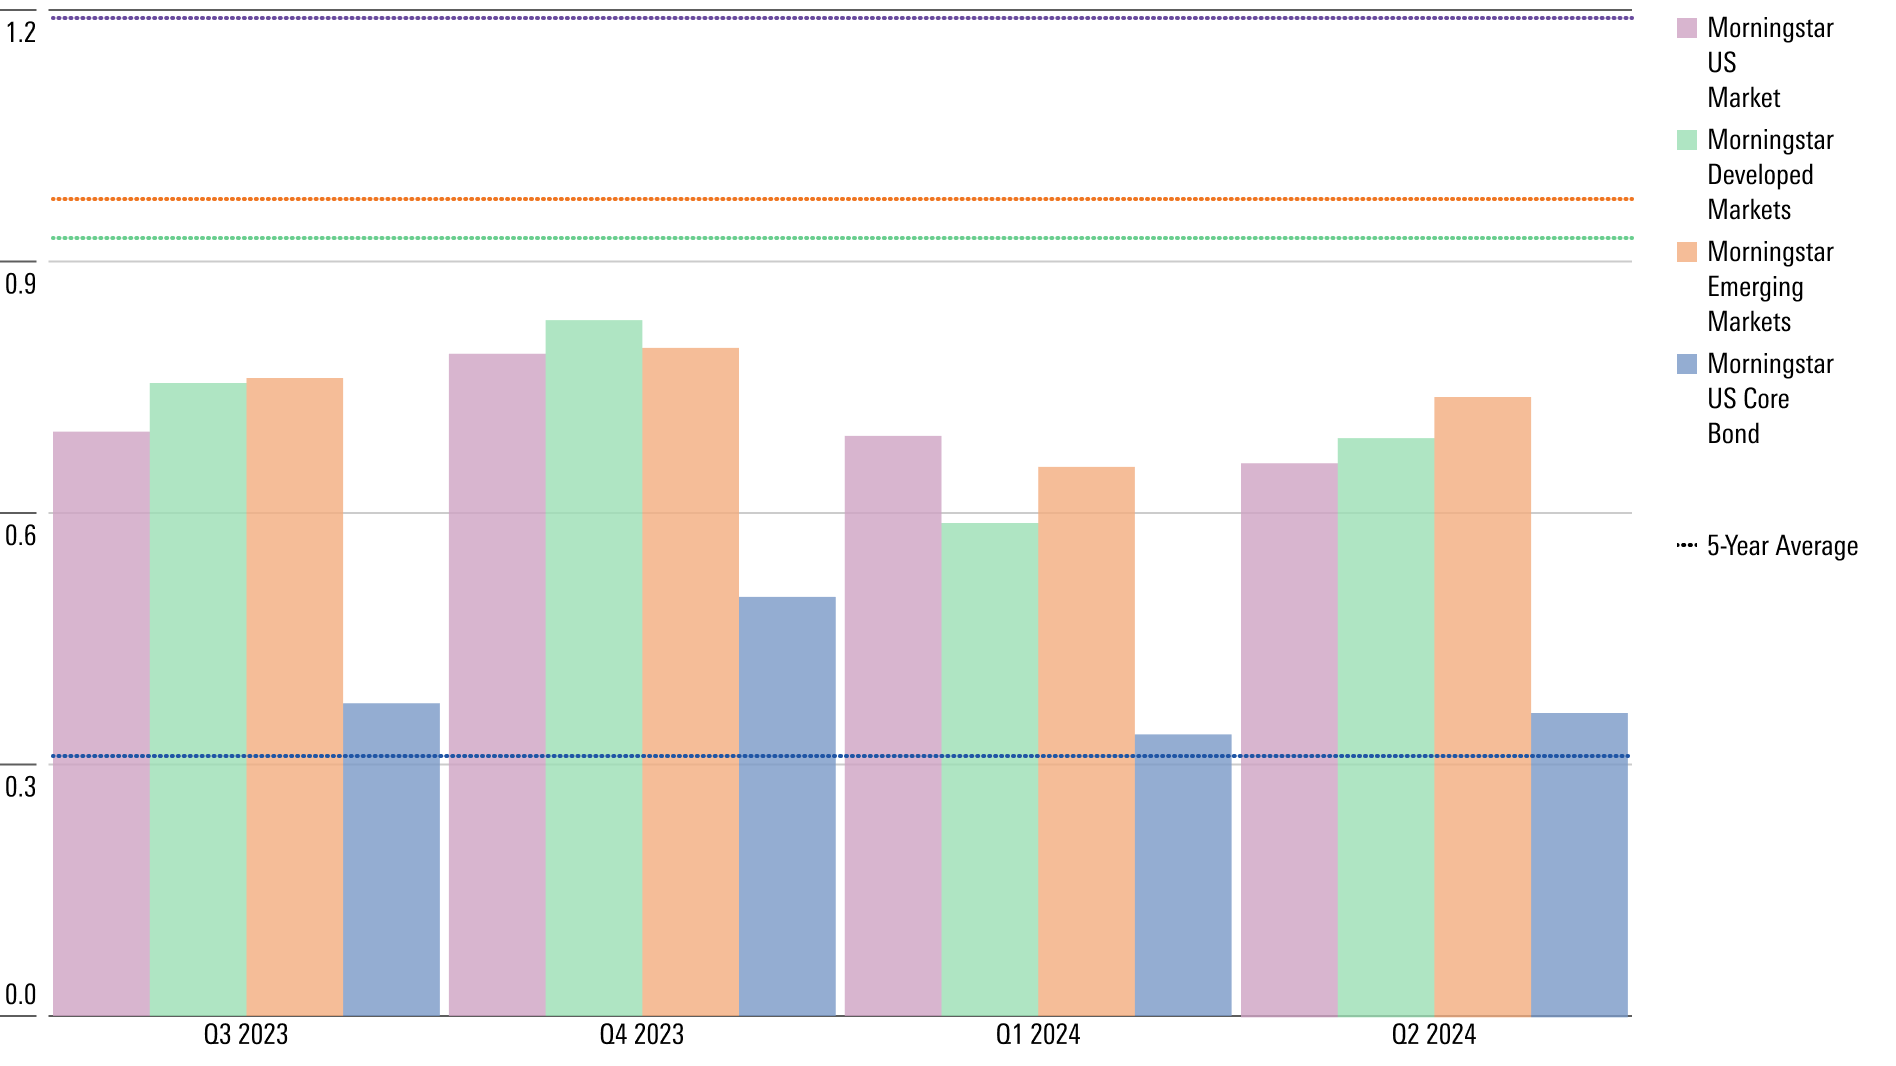
Volatility ticked up slightly from the first quarter but remained low compared to historical trends in the US stock market, developed markets, and emerging markets.
Volatility in the bond market remained above its five-year average and rose slightly from the first quarter, as investors recalibrated their expectations for interest rate cuts from the Fed.
Historical Standard Deviation
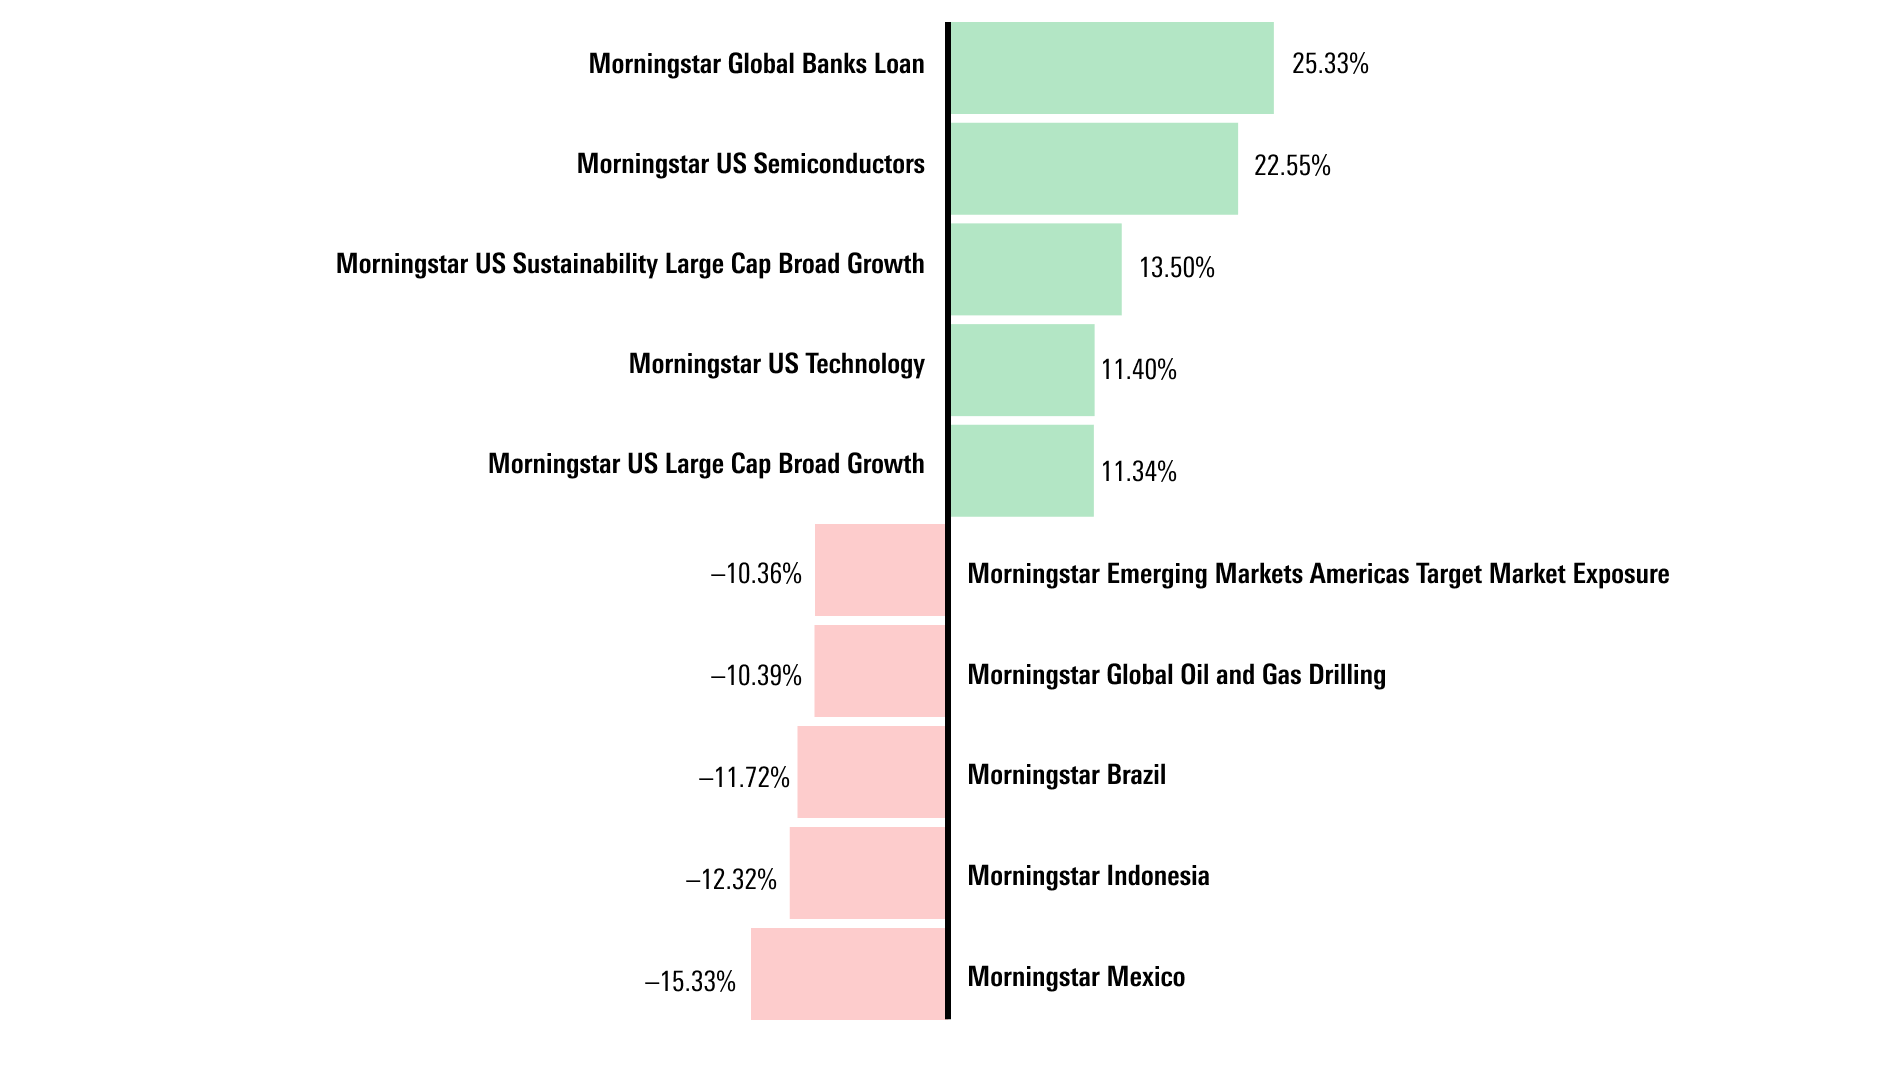
Q2′s Best and Worst Market Performers
Some of the biggest market gains in the second quarter came from semiconductors, with the US Semiconductor Index rising 22.55% thanks to Nvidia, which accounts for more than half of the index by weight. Chipmaker Broadcom AVGO, which gained 21.53% in the quarter, accounts for another 13.5%. Meanwhile, the Global Banks Loan Index returned 25.33% as interest rates remained elevated.
Mexican stocks struggled after the election of Claudia Sheinbaum to the country’s presidency, sending the Mexico Index down 15.33% for the quarter, as investors worried the politician’s policies could be bad for business. More broadly, emerging markets struggled, as did oil and gas stocks as crude prices fell.
Q2 Highlighted Top and Bottom Performers
Commodity Market Performance
WTI crude oil prices fell 2.59% in the second quarter after posting gains of more than 18% in the first months of the year. That turnaround helped push prices for gasoline and other consumer goods lower.
Gold, which investors often use as a hedge against geopolitical or economic uncertainty, gained 4.08% in the quarter after reaching record highs in March.
Meanwhile, copper prices climbed higher in April, reaching gains of more than 25%, before paring back and ending the quarter up 8.51%. Copper is used widely in industrial processes and products, and its performance is seen as a leading indicator of the global economy’s health.
Commodity Futures Performance
Q2 2024 Cryptocurrency Performance
Crypto struggled after posting banner gains in the first quarter, when it was boosted by the approval of the first spot bitcoin exchange-traded funds. Bitcoin ended the second quarter at roughly $60,000 per coin, down 13.64% from the all-time high of more than $73,000 per coin in March. Ethereum, the second most popular cryptocurrency, ended the quarter down 5.57%.
Cryptocurrency Performance
The author or authors do not own shares in any securities mentioned in this article. Find out about Morningstar’s editorial policies.
/cloudfront-us-east-1.images.arcpublishing.com/morningstar/MJ3FSXZXVFDYPHHGXT7LMKSZD4.png)
/cloudfront-us-east-1.images.arcpublishing.com/morningstar/ZKF5TFZDABBAHA6TLTRJH2OZHE.jpg)
/cloudfront-us-east-1.images.arcpublishing.com/morningstar/YI7RBXKMXVAZDBWEJYQREEJJL4.png)