Stock quote page
Take a tour of one of Morningstar.com's stock quote pages.
Morningstar's stock quote pages feature key trading information and statistics on specific stocks, including price, trailing returns, company financials, valuation, and more. To find a stock's quote page, type a ticker or company name into the search bar on any page of Morningstar.com. Morningstar Investor subscribers get access to additional analysis, as well as more performance and valuation data, on stock quote pages.
Below is an overview of key metrics on each stock quote page that can help you understand that stock's potential strengths and long-term value.

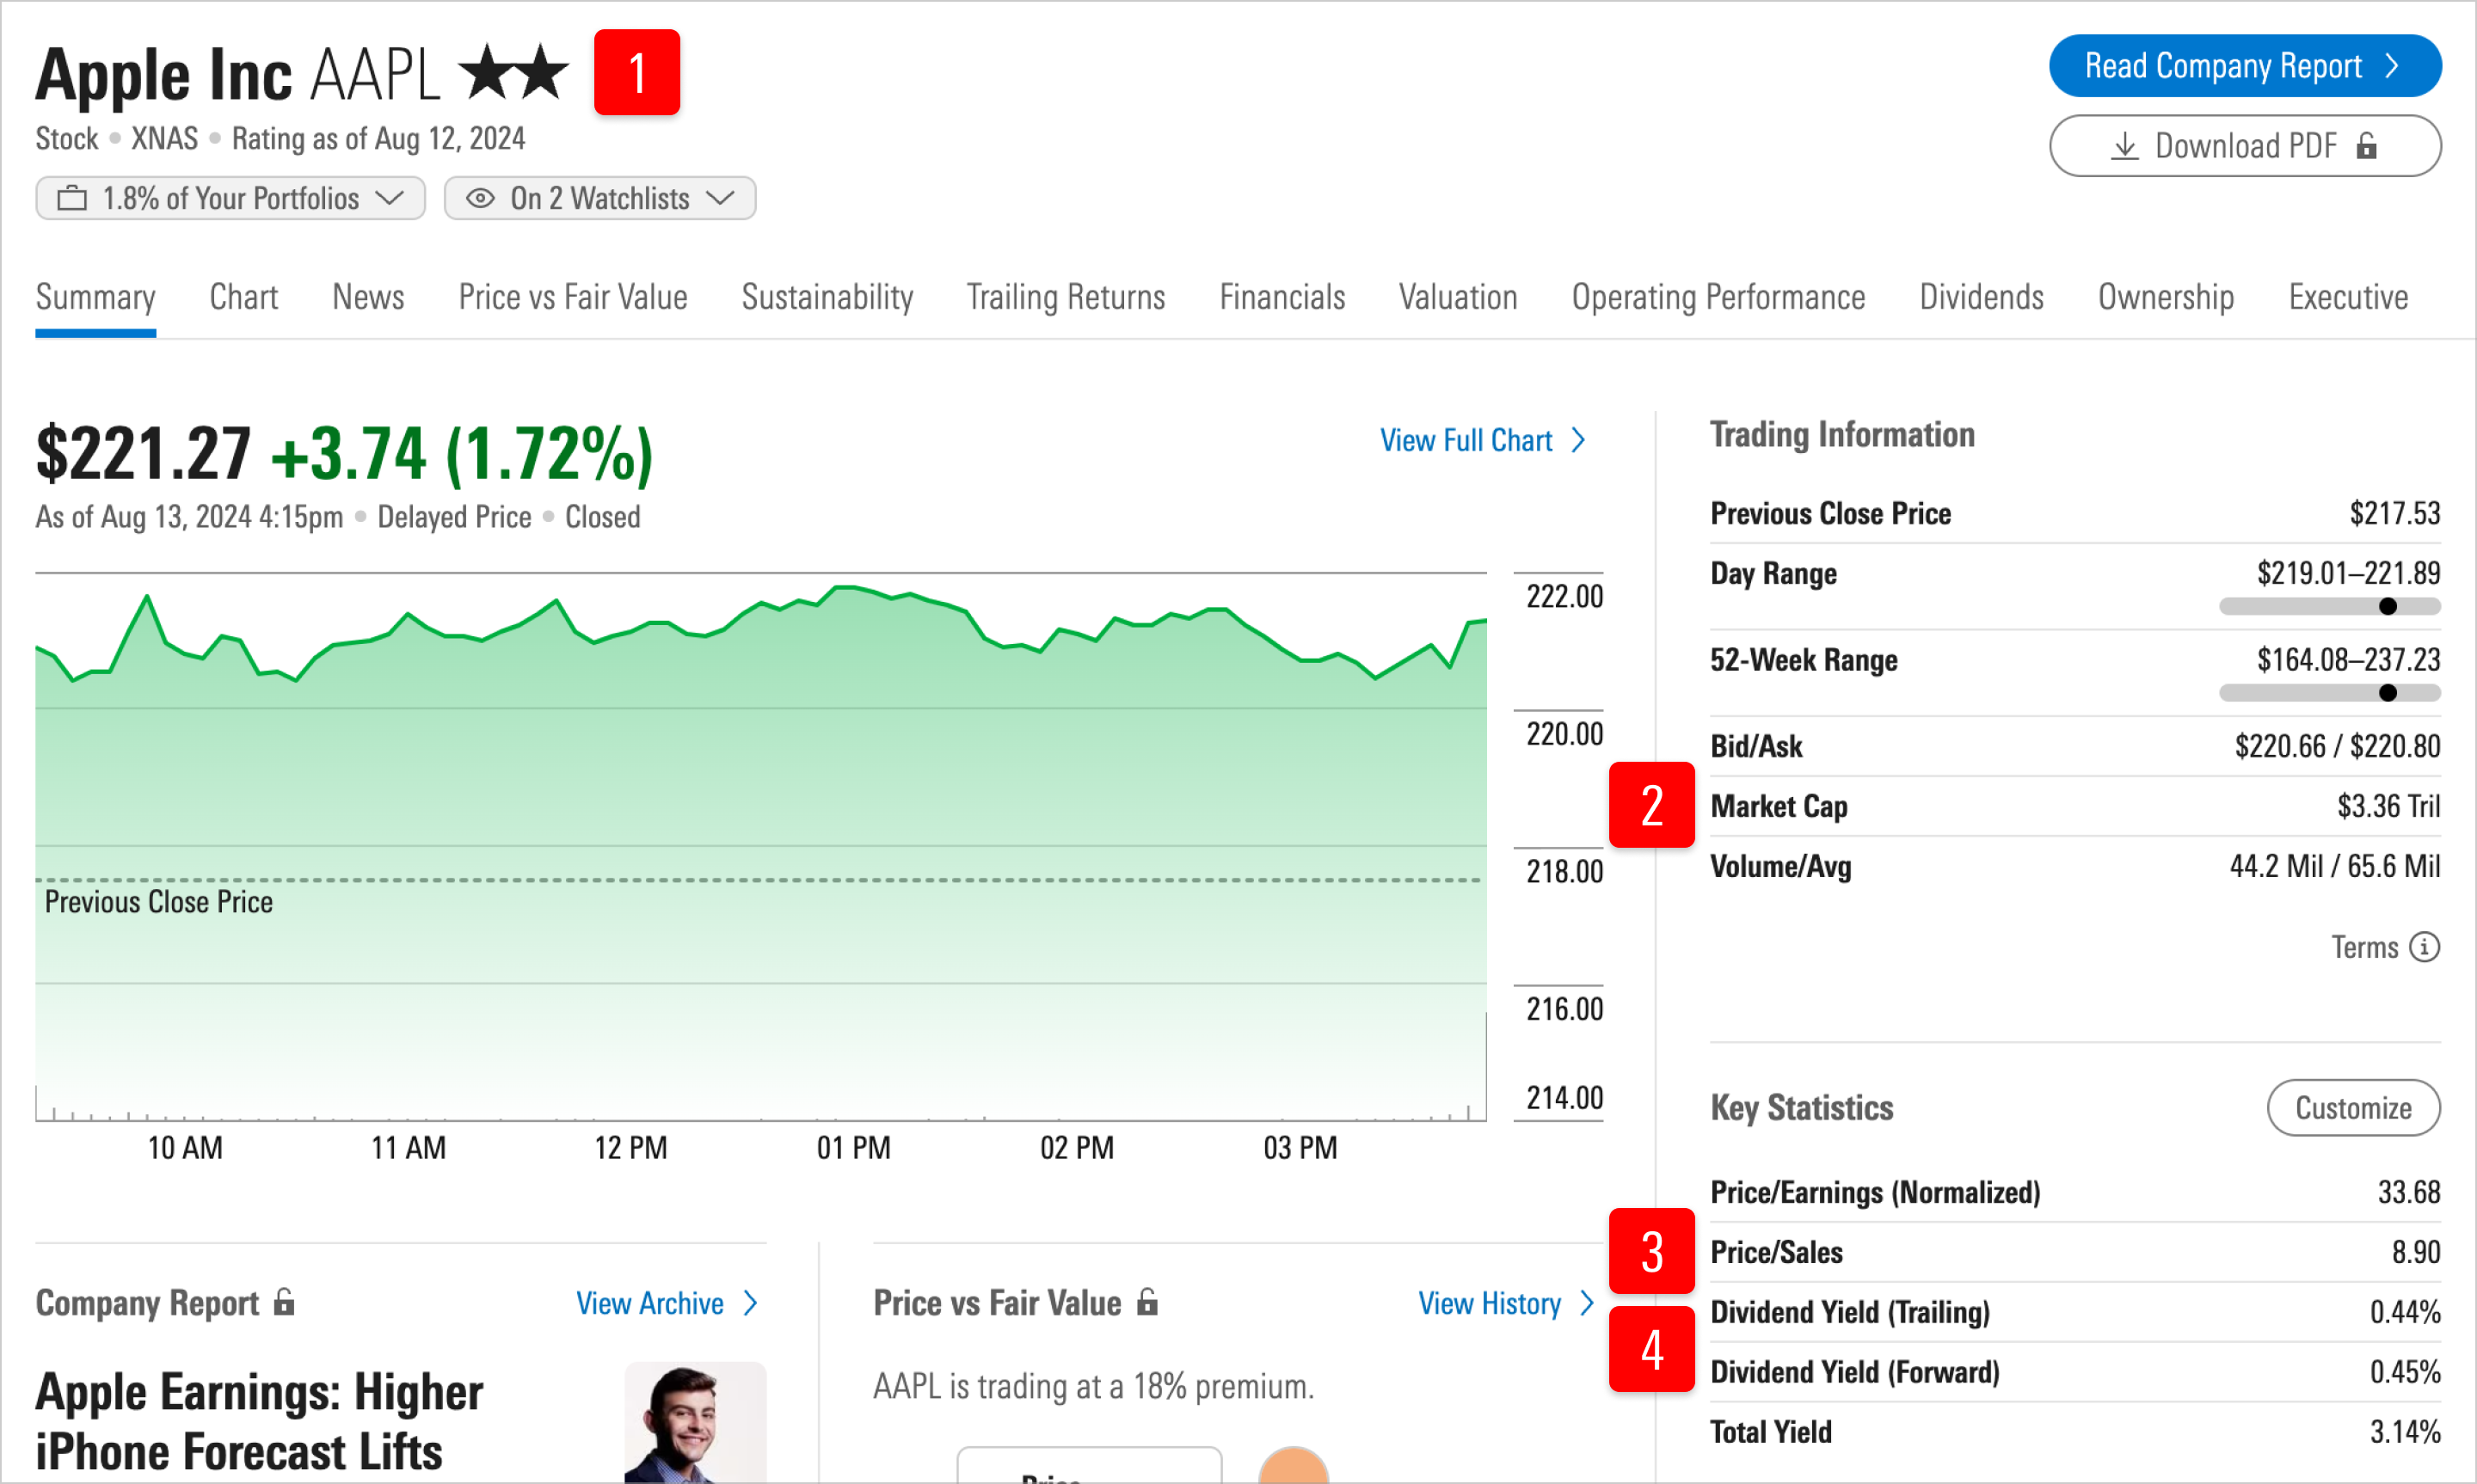
1. What is Morningstar's overall take of the stock?
- The Morningstar Rating for stocks (also called the star rating) tells you at a glance whether our analysts think a stock is undervalued or overvalued. A 5-star stock is underpriced relative to what our analysts think it’s worth, while a 1-star stock is overpriced and therefore has a significantly lower expected return.
- The star rating is calculated by comparing a stock’s current market price with our analyst’s estimate of the stock’s fair value—the bigger the discount (or premium), the more (or fewer) stars. Our rating system also includes an uncertainty adjustment, which makes it more difficult for a company to earn a 5-star rating if there is a wider range of possible outcomes that make us less certain of our fair value estimate.
- We think 3-star stocks should offer a “fair return” that adequately compensates for the riskiness of the stock. We consider these stocks fairly valued, and we think they should offer investors a return that’s roughly comparable to the stock’s cost of equity. (The cost of equity is often called a “required return” because it represents the return an investor requires for taking on the risk of owning the stock.)
2. How big is the company?
Market cap is the total equity market value of the company, expressed in millions of dollars. It equals shares outstanding times the stock price.
3. How expensive is this company using standard valuation metrics?
- Price/sales: A stock’s current price divided by the company’s trailing 12-month sales per share. It represents the amount an investor is willing to pay for a dollar generated from a particular company’s operations.
- Price/book: A stock’s current price divided by its book value per share (the total assets of a company, less total liabilities). The price/book ratio can tell investors approximately how much they’re paying for a company’s assets, based on historical, rather than current, valuations. Historical valuations generally do not reflect a company’s current market value. Value investors frequently look for companies that have low price/book ratios.
4. What dividends (if any) can I expect from the stock?
The forward dividend yield is the dividend we expect the stock to pay over the next 12 months (based on its declared dividend policy), divided by the stock’s current price. For example, if a company is expected to pay $0.25 per quarter, or $1.00 per year, and it’s trading for $100/share, its forward dividend yield is 1%.

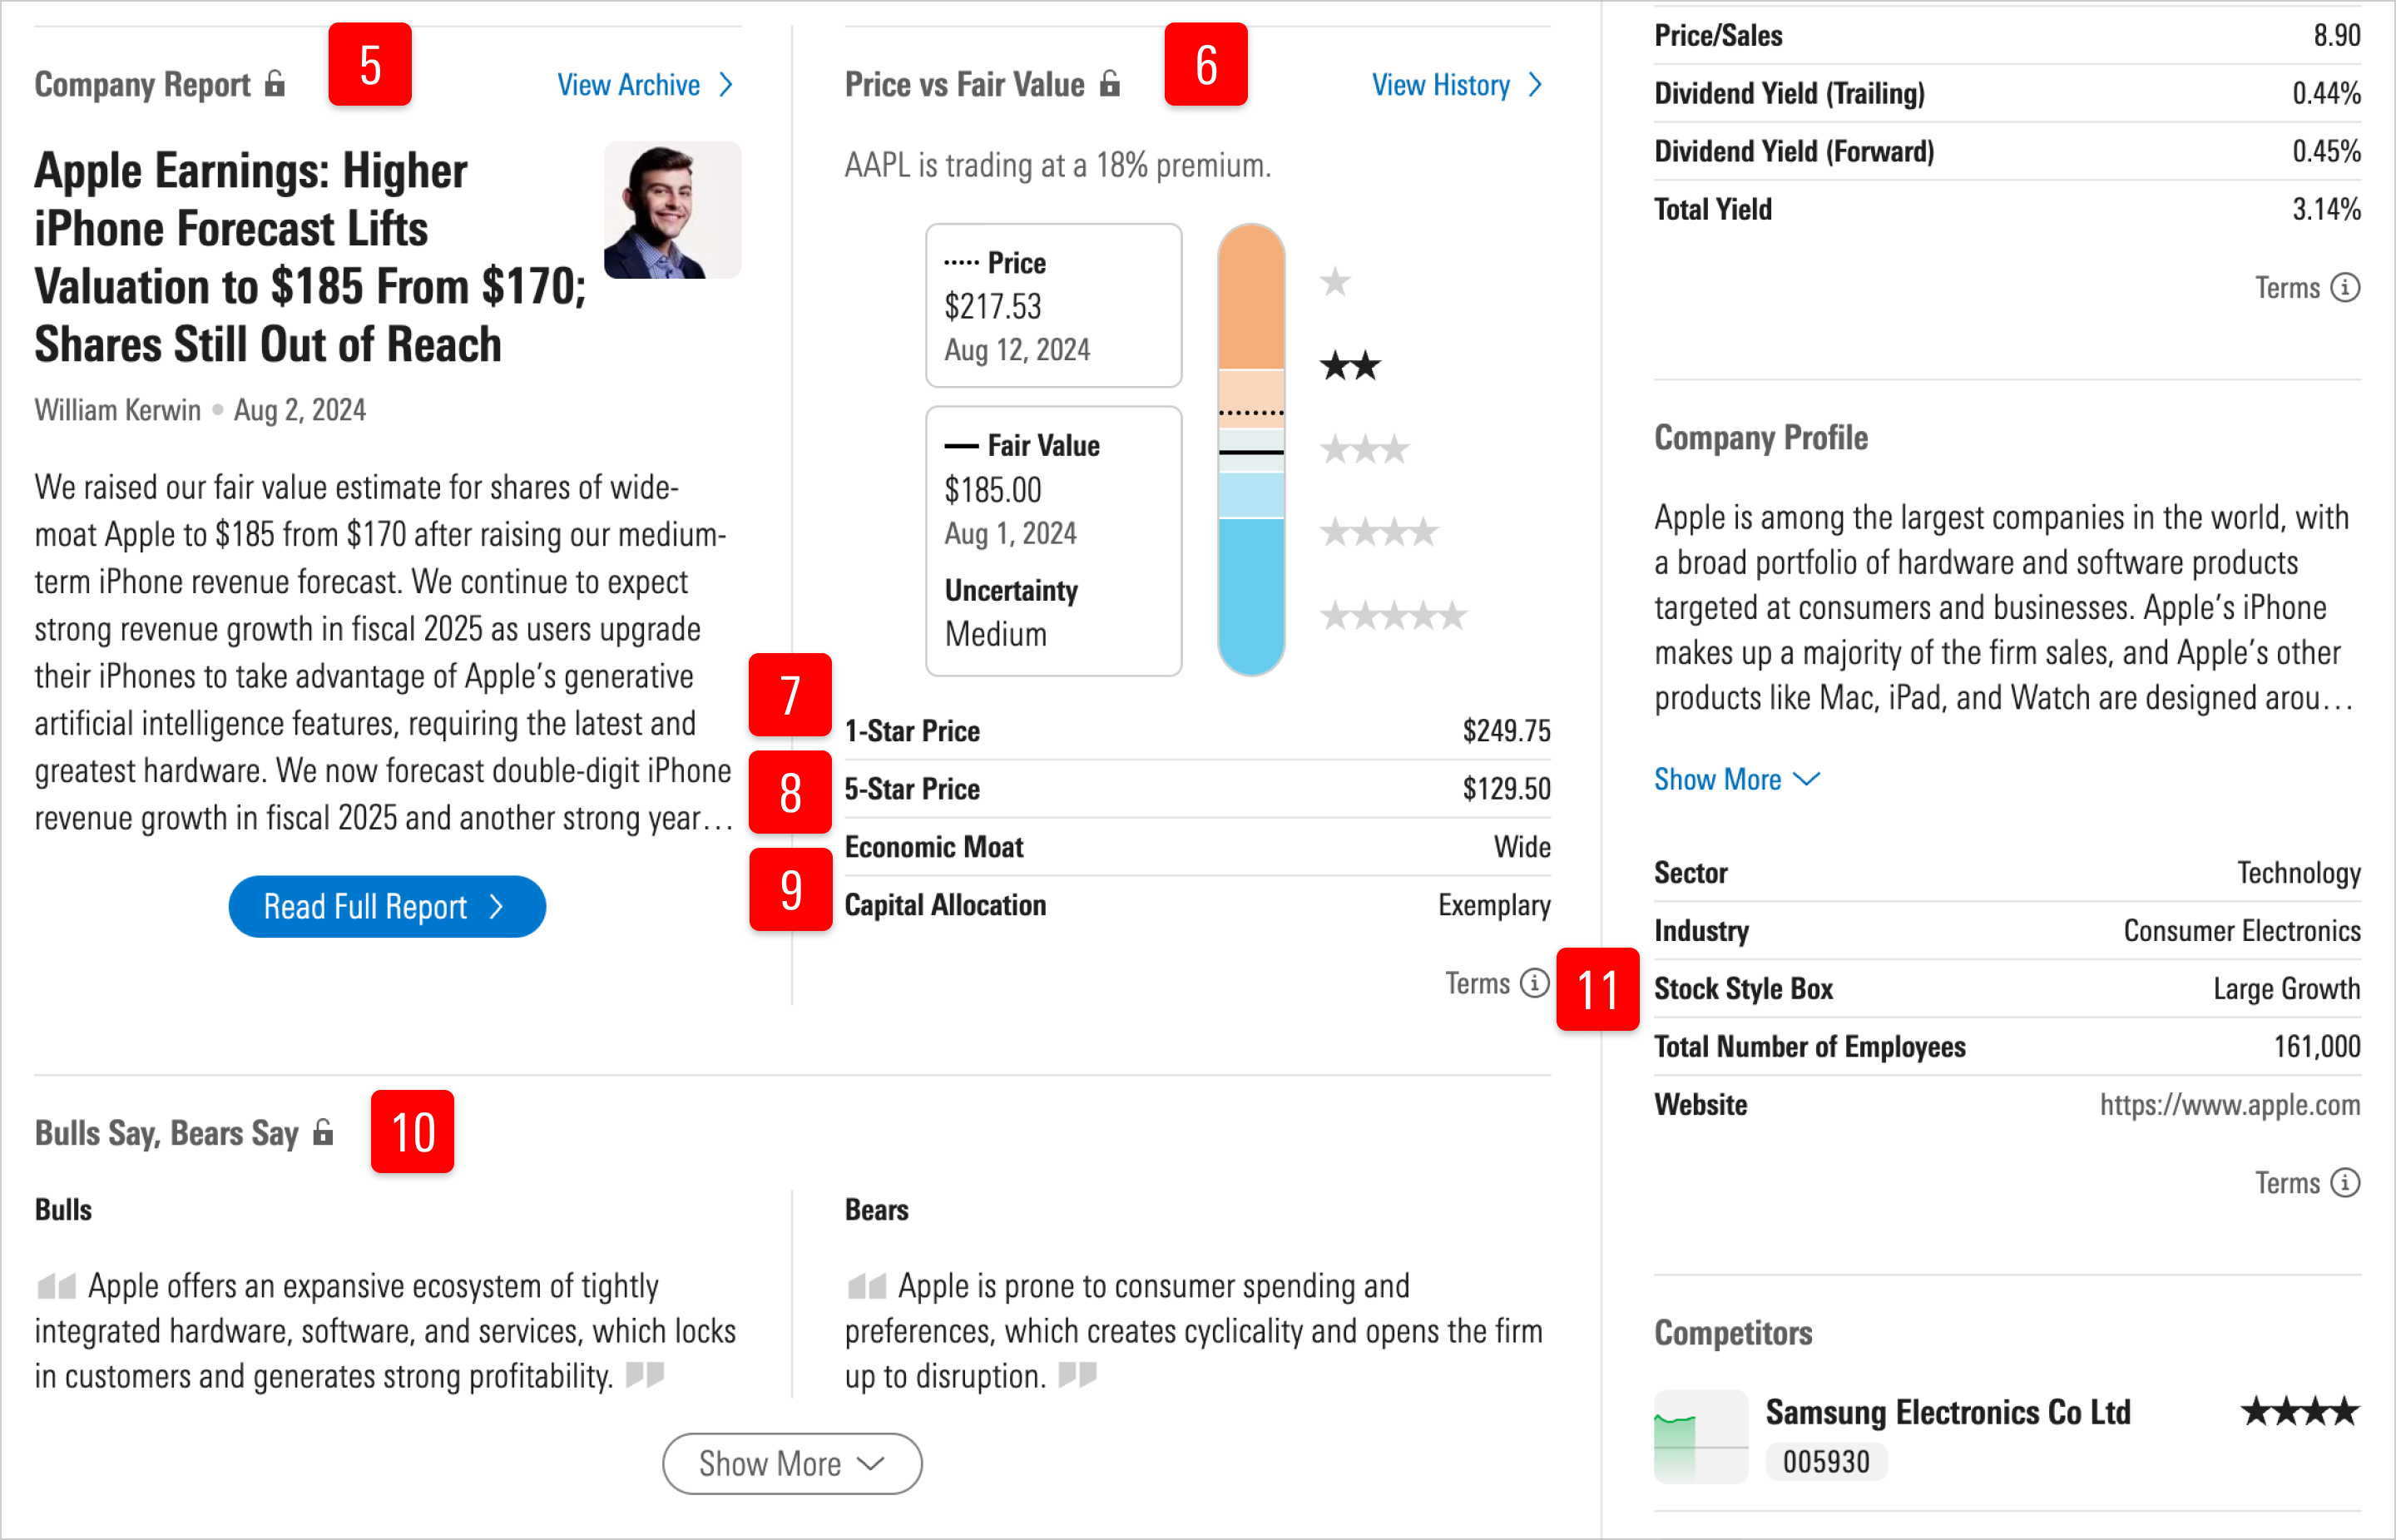
5. How can I get an aggregate view of Morningstar's analysis of a company?
Company reports are platforms for our analysts to assess investments fairly, accurately, and from the investor's point of view—and to dig deep into the details. They're available with a subscription to Morningstar Investor.
6. What do Morningstar analysts really think this stock is worth?
- The Morningstar Fair Value Estimate is a per-share price estimate of what our analysts think a stock is worth. It’s based on our thorough analysis of the company’s current operations, business risks and opportunities, and outlook.
- The Morningstar Uncertainty Rating gives investors an idea of how tightly we feel we can bind our fair value estimate for any given company. Analysts consider the following factors: sales predictability, operating leverage, financial leverage, and a firm’s exposure to contingent events. Based on these factors, analysts assign one of five uncertainty levels: Low, Medium, High, Very High, or Extreme. The greater the level of uncertainty (or the wider the range of potential outcomes), the greater the discount to fair value required before a stock can earn a 5-star rating. In other words, a speculative biotech firm whose fortunes rest on the success or failure of one product might have a very high fair value uncertainty rating and would require a larger discount to fair value before it hit 5 stars than a more diversified pharmaceutical company that has more predictable earnings. The opposite scenario is true for a 1-star stock: A stock whose fair value estimate is more uncertain would need to trade at a price significantly above our fair value estimate before we would consider it to be very overvalued.
7. Is this a good time to sell this stock?
The 1-star price is the price above which Morningstar analysts consider the stock significantly overvalued. A superscript Q indicates that the price was determined by a quantitative model.
8. Is this a good time to buy this stock?
The 5-star price is the price below which Morningstar analysts consider the stock significantly undervalued. A superscript Q indicates that the price was determined by a quantitative model.
9. How strong are the company’s competitive advantages?
- The Morningstar Economic Moat Rating (moat rating) measures the strength of a company’s sustainable competitive advantage. A company with an economic moat can fend off competition and earn high returns on capital for many years to come.
- The moat rating can help you identify companies that will provide superior long-term returns. A company whose competitive advantages we expect to last more than 20 years has a wide moat, one that can fend off their rivals for 10 years has a narrow moat, and a firm with either no advantage or one that we think will quickly dissipate has no moat.
- Morningstar has identified five sources of moat. Switching costs are those obstacles that keep customers from changing from one product to another. The network effect occurs when the value of a good or service increases for both new and existing users as more people use that good or service. Intangible assets are things such as patents, government licenses, and brand identity that keep competitors at bay. A company with a cost advantage can produce goods or services at a lower cost, allowing them to undercut their competitors or achieve higher profitability. Efficient scale benefits companies operating in a market that only supports one or a few competitors, limiting rivalry.
10. What are the opposing viewpoints on this stock?
Bulls Say/Bears Say presents the most important positives and negatives for every company––regardless of our current opinion. You’ll see the Bear case for our favorite companies, and the Bull case for the companies we wouldn’t touch unless they were dirt cheap.
11. What is the stock's investment style?
- We classify stocks into a nine-square grid arranged according to three size ranges (small-, mid-, and large-capitalization) and three investment styles (value, core, and growth). The cutoffs between the capitalization bands float; the smallest 10% of companies in the investable U.S. market are considered small cap; the next rung, mid-caps, encompasses those 20% of companies between small-cap and large-cap stocks, which make up the largest 70% of U.S. stocks.
- Once stocks are sorted by size, we classify them as growth, value, or core. We classify stocks as value if they are trading at low valuations (characterized by low price ratios and high forward dividend yields) and exhibit low growth rates for earnings, sales, book value, and cash flow. We classify stocks as growth if they have high growth rates for earnings, sales, book value, and cash flow and if they are trading at high valuations (high price ratios and low dividend yields). In the case of core stocks, neither growth nor value characteristics predominate.
