
Another Month, Another Milestone: 10 Reasons the ETF Market Reached $10 Trillion in Q3
US ETFs reeled in a record $282 billion in the third quarter of 2024.
/s3.amazonaws.com/arc-authors/morningstar/30e2fda6-bf21-4e54-9e50-831a2bcccd80.jpg)
US exchange-traded fund assets soared over $10 trillion last month, the latest milestone for the burgeoning market.
Gains in stocks and bonds helped push ETFs over the $10 trillion mark. The Morningstar Global Markets Index advanced 2.3% in September, pushing its return to 17.9% over the first three quarters of 2024. The Morningstar US Core Bond Index notched gains of 1.3% and 4.5% over the respective periods. That favorable market backdrop would expand the ETF treasure chest even if flows into the products lost steam.
Instead, flows have accelerated. ETFs raked in $282 billion in the third quarter and $696 billion since the calendar turned to 2024. They are on pace to clip the $900 billion annual flows record set in 2021, and history indicates that $1 trillion is well within reach. As Exhibit 1 shows, ETFs have historically enjoyed their strongest inflows in the fourth quarter.
Historical Growth Rates for ETFs by Quarter
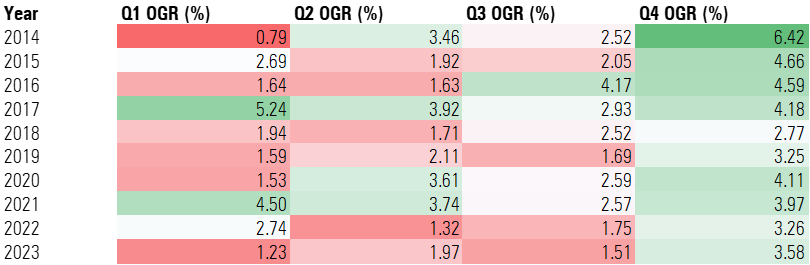
There’s no guarantee that seasonal trend will spill into 2024′s closing act. So instead of projecting the quarter ahead, let’s review the quarter that was and explore the trends that defined it.
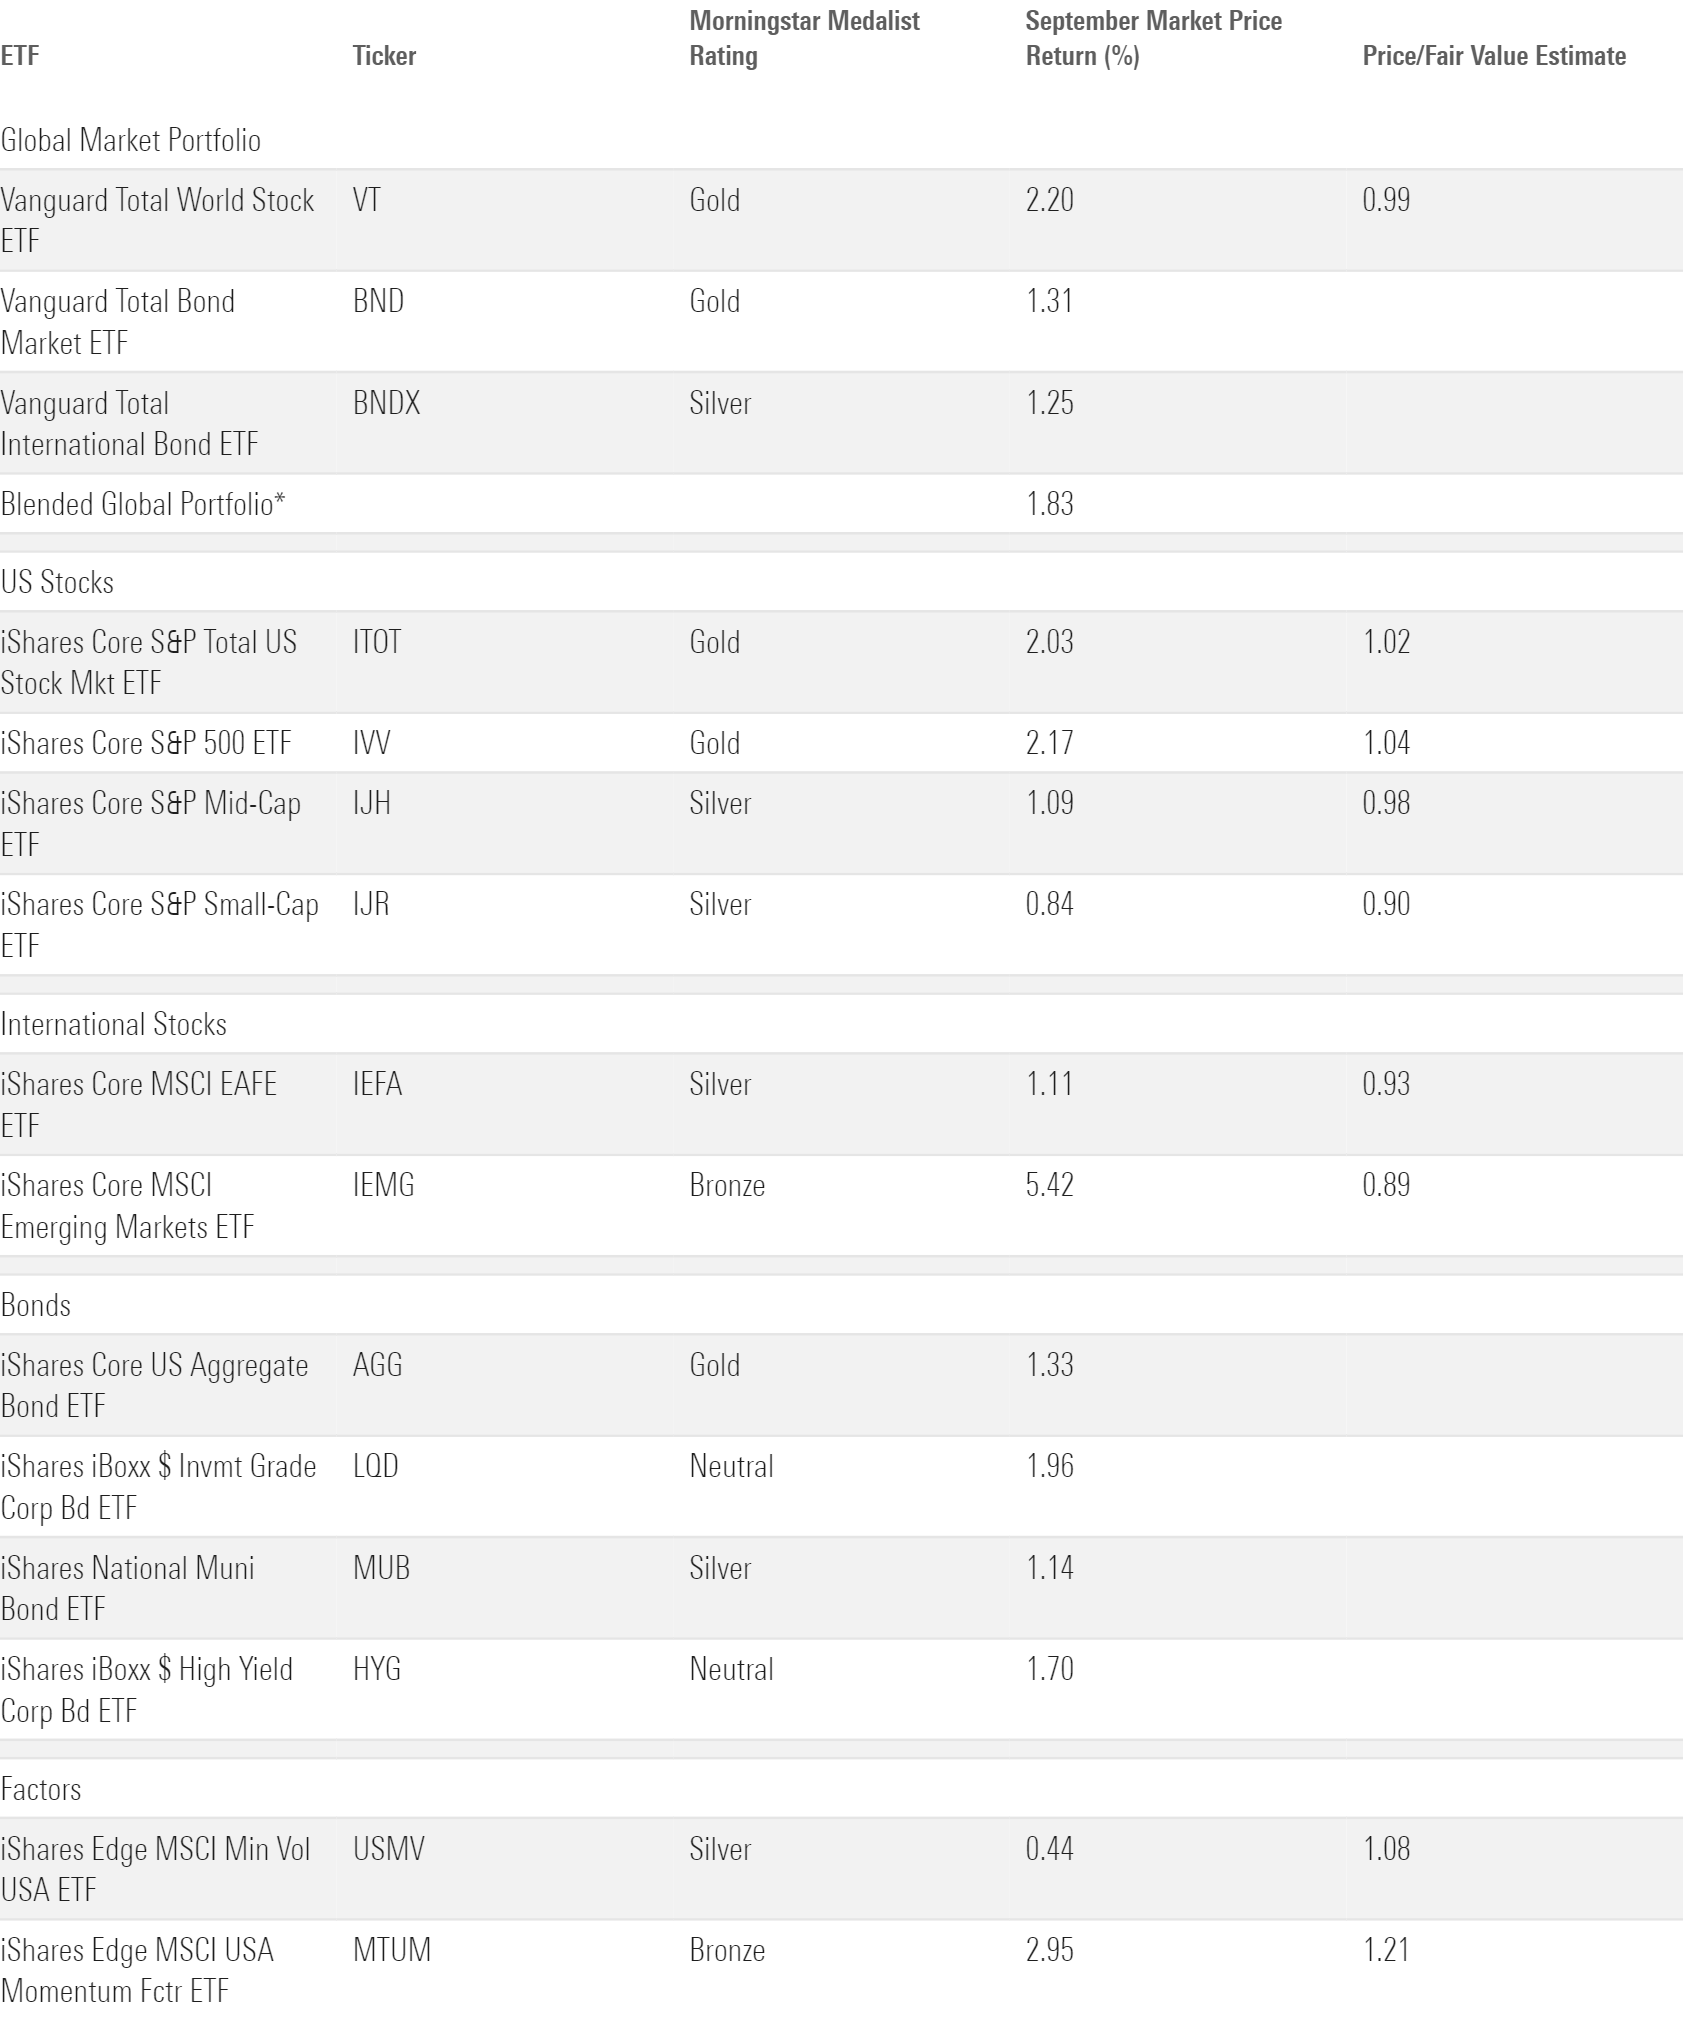
September Market Performance Through the Lens of Analyst-Rated ETFs
1. Taxable-Bond ETFs Lead the Charge
Investors poured more than $93 billion into taxable-bond ETFs in the third quarter, shattering the $81-billion record from second-quarter 2020. A global pandemic and spiraling stock prices ignited that breakout. The backdrop was friendlier this time around: The promise of imminent rate cuts pulled investors toward fixed-income portfolios, whose prices stood to rise once rates started to fall.
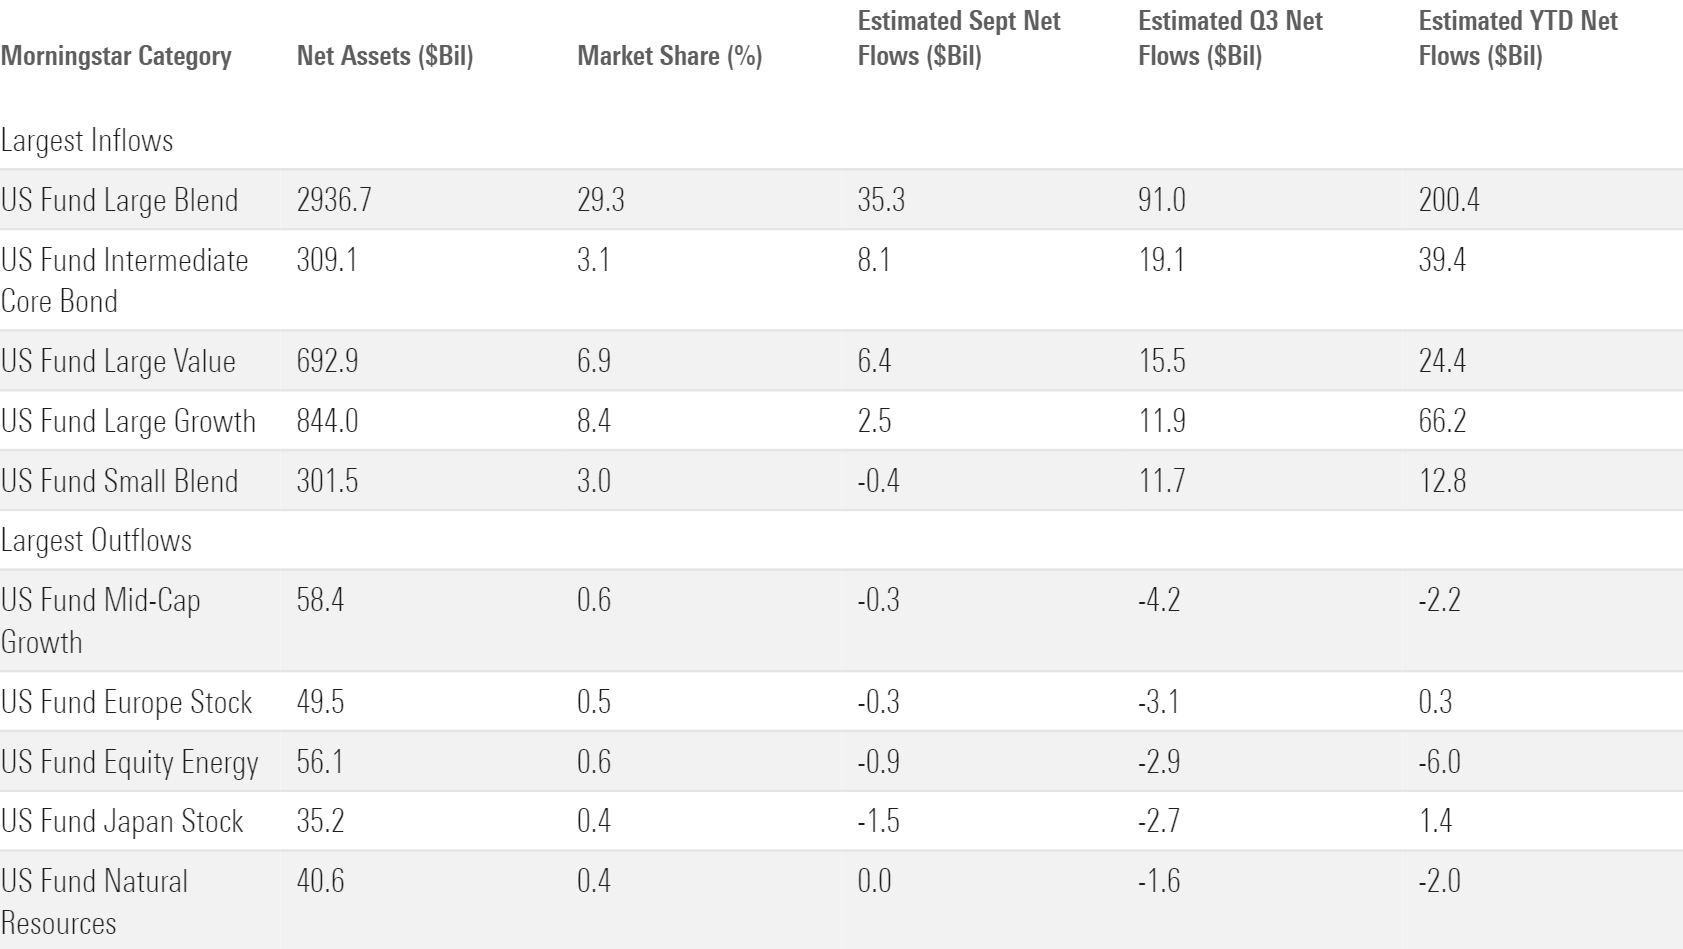
Just about every corner of the taxable-bond cohort felt the love. Of 22 taxable-bond categories, 21 finished the third quarter with inflows. Intermediate-core bond funds pulled in roughly $19 billion to lead the way, behind only large-blend stocks among all Morningstar Categories.
2. Long- and Short-Term Bond ETFs in Vogue
Longer-dated bond funds reeled in $11 billion in the third quarter, nearly all of which came during July and August. These funds tend to be more sensitive to interest-rate changes (and rate expectation changes), a feature that made them popular before the Fed officially cut rates by 50 basis points in September. In fact, long-term bond funds have long been in high demand because investors expected rate cuts well before they came. The long-government category reeled in $93 billion from January 2022 through June 2024, a span in which headliner iShares 20+ Treasury Bond ETF TLT lost roughly one third of its value.
Short-term bond funds have been an afterthought since the prospect of interest-rate cuts entered the market consciousness. Over the 12 months ended June 2024, the short government category bled $10 billion and the diversified short-term bond category $9 billion. But they righted the ship once rate cuts arrived. Those categories combined for more than $5 billion of inflows from July through September 2024, their best quarter in more than two years. That turnaround could signal the start of a new trend.
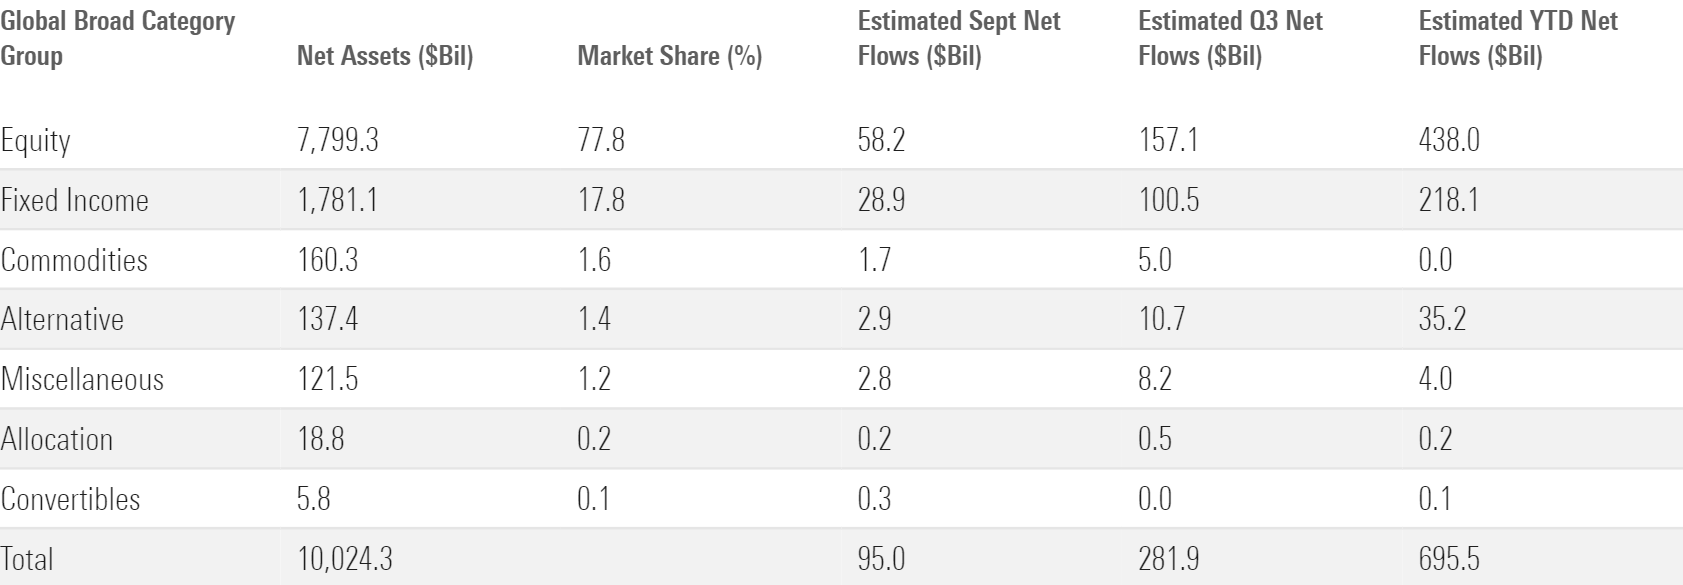
September Flows Across Morningstar Broad Category Groups
3. Active ETFs Fuel Bond Flows
Actively managed ETFs have lifted flows into ETFs of all stripes, but fixed-income categories have benefited more than equities. Roughly 34% of bond-ETF flows this year went to active products, compared with 23% for stock ETFs. Active bond ETFs raked in more than $30 billion in the third quarter alone.
Index ETFs still dominate the intermediate-core and government-bond categories, but active ETFs have pulled a wider range of fixed-income segments into the limelight. The intermediate core-plus category reeled in $23 billion over the first three quarters—$14 billion of it into active strategies. The multisector-bond cohort entered 2024 with $5 billion and swelled to $14 billion behind flows into active ETFs like BlackRock Flexible Income ETF BINC. Active strategies helped even smaller segments like nontraditional bond and bank loan to take root in the ETF structure, too.
The midyear 2024 Active/Passive Barometer was the latest research to indicate active management works better in bond than stock markets. The number of active bond ETFs and the flows into them are starting to reflect that.
4. US Stock ETFs Are No Slouch, Either
The Morningstar US Market Index climbed 6.1% in the third quarter and 20.1% for the year to date through September. Investors didn’t want to miss the party: They poured roughly $132 billion into US equity ETFs during the third quarter, good for an organic growth rate of about 2.7%.
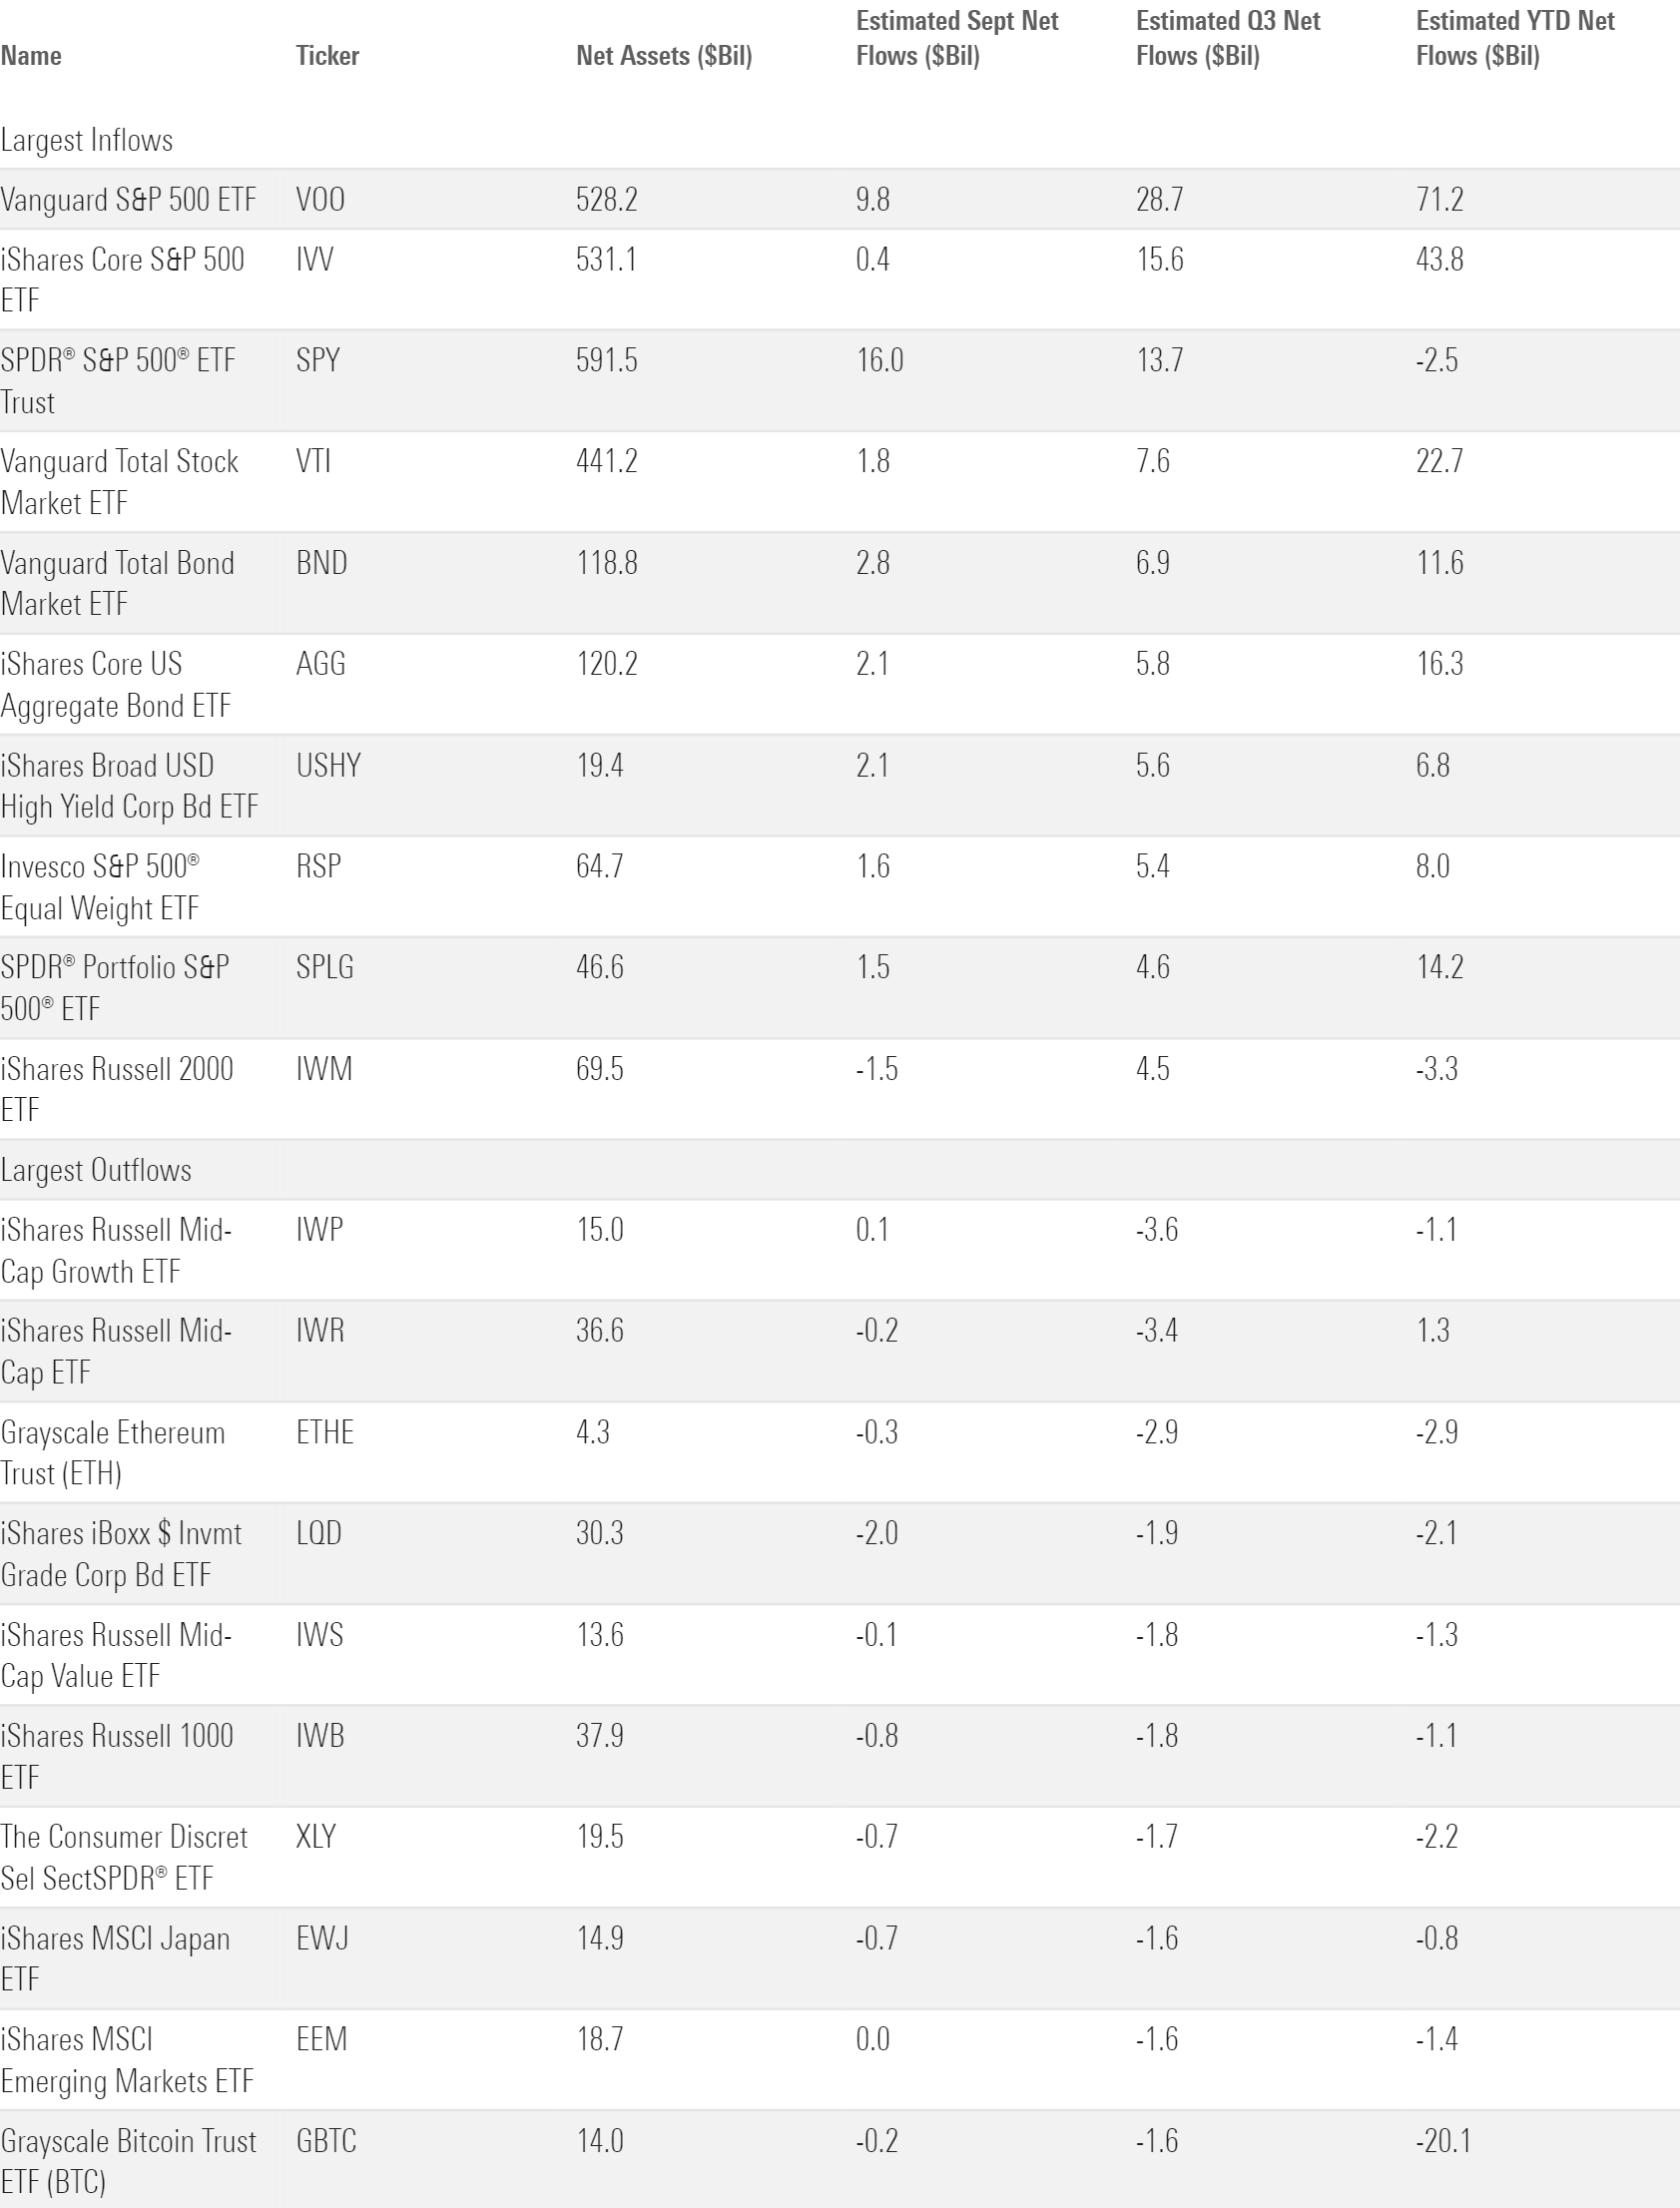
Large-blend funds dominate the ETF landscape. Close to 30% of all ETF money sits in that category—a stranglehold it has shown no signs of relinquishing. The large-blend category raked in $91 billion in the third quarter, a little less than one third of all US ETF net flows. S&P 500 trackers from the three largest ETF providers gobbled up the bulk of it. Vanguard S&P 500 ETF VOO reeled in $29 billion, followed by iShares Core S&P 500 ETF IVV ($16 billion) and SPDR S&P 500 ETF Trust ETF SPY ($14 billion).
Flavor-of-the-month ETFs can be interesting and sometimes attention-worthy. But the US ETF market still runs through the core index funds that laid claim to it first.
ETFs With the Largest Q3 Flows
5. Large-Value Flows Perk Up Behind Dividend ETFs
Large-value ETFs suffered their first calendar year of outflows in 2023 and wobbled early in 2024, collecting just $9 billion during the first half. The third quarter saw them round back into form with nearly $16 billion of inflows.
A turnaround in dividend ETF flows helps explain the large-value improvement. Dividend-focused strategies represented 38% of the large-value cohort at the end of 2023. Sticking with a trend from the previous year, investors yanked $3 billion from them in the first half of 2024. But they righted the ship in the third quarter with $5 billion of inflows, including a $2-billion September that marked their best month since December 2022. Lower yields in the bond market could catalyze a shift back into dividend ETFs as investors return to equity products for their income needs.
Large-value funds need a strong fourth quarter to turn around another quiet year. The $24 billion they hauled in over the first three quarters trailed the large-growth category by about $42 billion.
Morningstar Categories With the Largest September Flows
6. Small-Cap Flows Just a Flash in the Pan?
Small-cap funds were all the rage in July. IShares Core S&P Small-Cap ETF IJR soared 11%, and investors poured $14 billion into small-cap funds.
Their day in the sun proved to be short-lived, however. Small-cap categories collectively drew in $2 billion in August, then under $1 billion in September. Large-cap portfolios regained their performance edge during those months and cast July as a small blip on the radar.
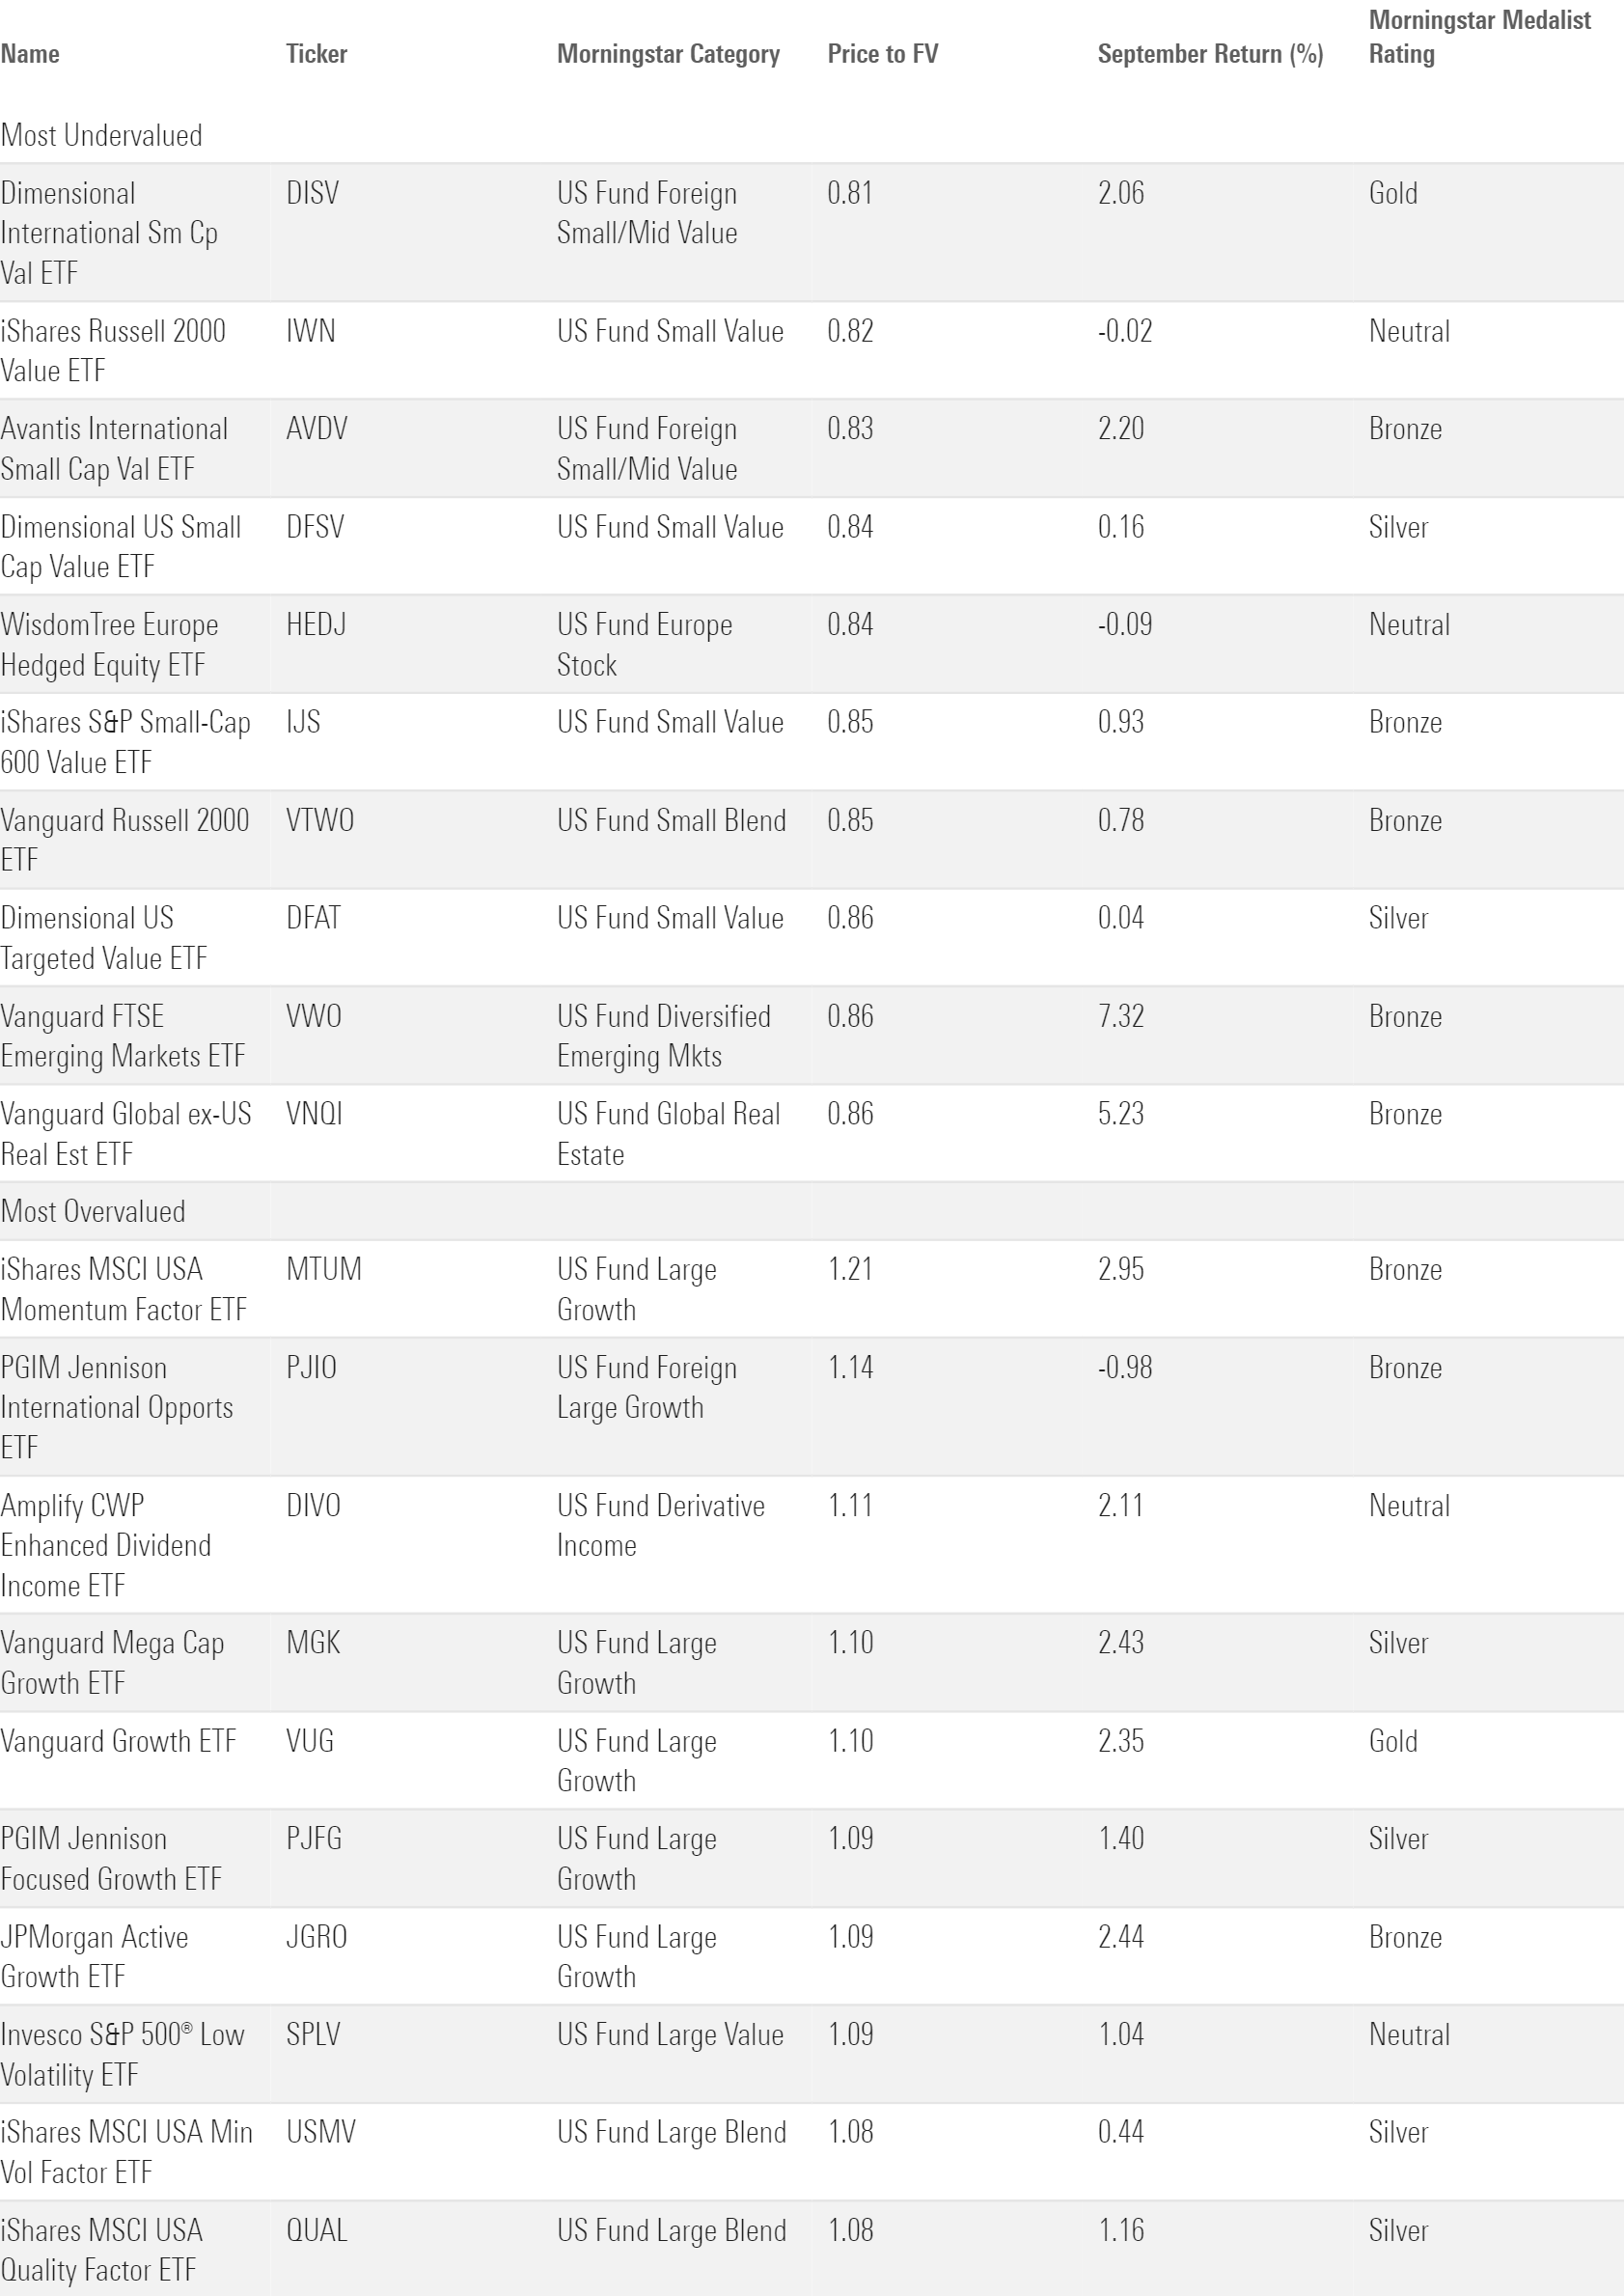
Still, the tremendous July helped small-cap funds total $26 billion of inflows over the first three quarters. They are in position to challenge the $38-billion inflow record they notched in 2021. The Morningstar Q4 Stock Market Outlook lists the small-cap sphere as one of the market’s most undervalued—a status that could usher in fresh inflows to close out the year.
The 10 Most Over- and Undervalued ETFs
7. Blend or Bust for International Equity ETFs
International-stock funds hauled in $54 billion during the first half of 2024 but cooled off in the third quarter with $14 billion of inflows. Nearly all of the third-quarter flows rushed into the foreign large-blend category, the largest of the cohort. It pulled in $11 billion from July through September, raising its 2024 haul to nearly $42 billion.
Investors have shied away from international-equity funds that target specific regions or countries, though. They pulled investment from categories that focus on Asia-Pacific countries, Latin America, Japan, Europe, and China (though the latter’s furious market rally sparked inflows in September). Even the breakout India-equity category lost momentum, collecting quarterly inflows below $1 billion for the first time since first-quarter 2023.
The US stock market has dominated most of its major foreign counterparts for years. Perhaps investors have tired of speculating which market will buck the trend and opted instead to own a broader basket of them.
8. Sector Equity Flows Follow Performance
In the first half of 2024, technology funds reeled in $15 billion, while the other 15 sector-equity categories collectively bled nearly $9 billion. Tech funds’ performance slowed down in the third quarter, however, and so did the flows into them. The category collected $3 billion as The Technology Select Sector SPDR ETF XLK was basically flat on the quarter.
The other categories picked up the slack. During the third quarter, real estate and utilities funds absorbed $4 billion and $2 billion, respectively, to flip their 2024 net flows from negative to positive. Performance likely prompted the turnaround. The Utilities Sector SPDR ETF XLU led the State Street suite of sector funds with a 19.4% third-quarter return, followed by The Real Estate Select Sector SPDR ETF’s XLRE 17.1% gain.
Technology funds stand alone in the sector-equity cohort; the next-largest category is about one third its size. But flows into smaller players could persist if the performance patterns from the third quarter have staying power.
9. Alternatives Don’t Go Anywhere
The alternative category group reeled in $10 billion in the third quarter to push its 2024 inflows up to $35 billion. Scaled for size, that equates to a 47% organic growth rate on the year.
Crypto and buffer ETFs drove the superb growth. The Morningstar Categories that house those products hauled in roughly $5 billion apiece in the third quarter. Spot ethereum ETFs launched in late June, and their first full months of trading gave the digital assets category a small boost. Bitcoin ETFs figure to keep dominating the space, though. IShares Bitcoin ETF Trust IBIT pulled in almost $4 billion in the third quarter, while the brand-new iShares Ethereum Trust ETF ETHA has collected just over $1 billion since its debut.
10. Vanguard in the Driver’s Seat
Vanguard entered the third quarter with nearly $120 billion of net flows on the year, about $15 billion ahead of chief rival iShares. It blew open that lead shortly thereafter. Investors dumped $85 billion into Vanguard ETFs from July through September, falling just shy of Vanguard’s record $87-billion quarter to open 2021.
Q3 Flows for the 10 Largest ETF Providers
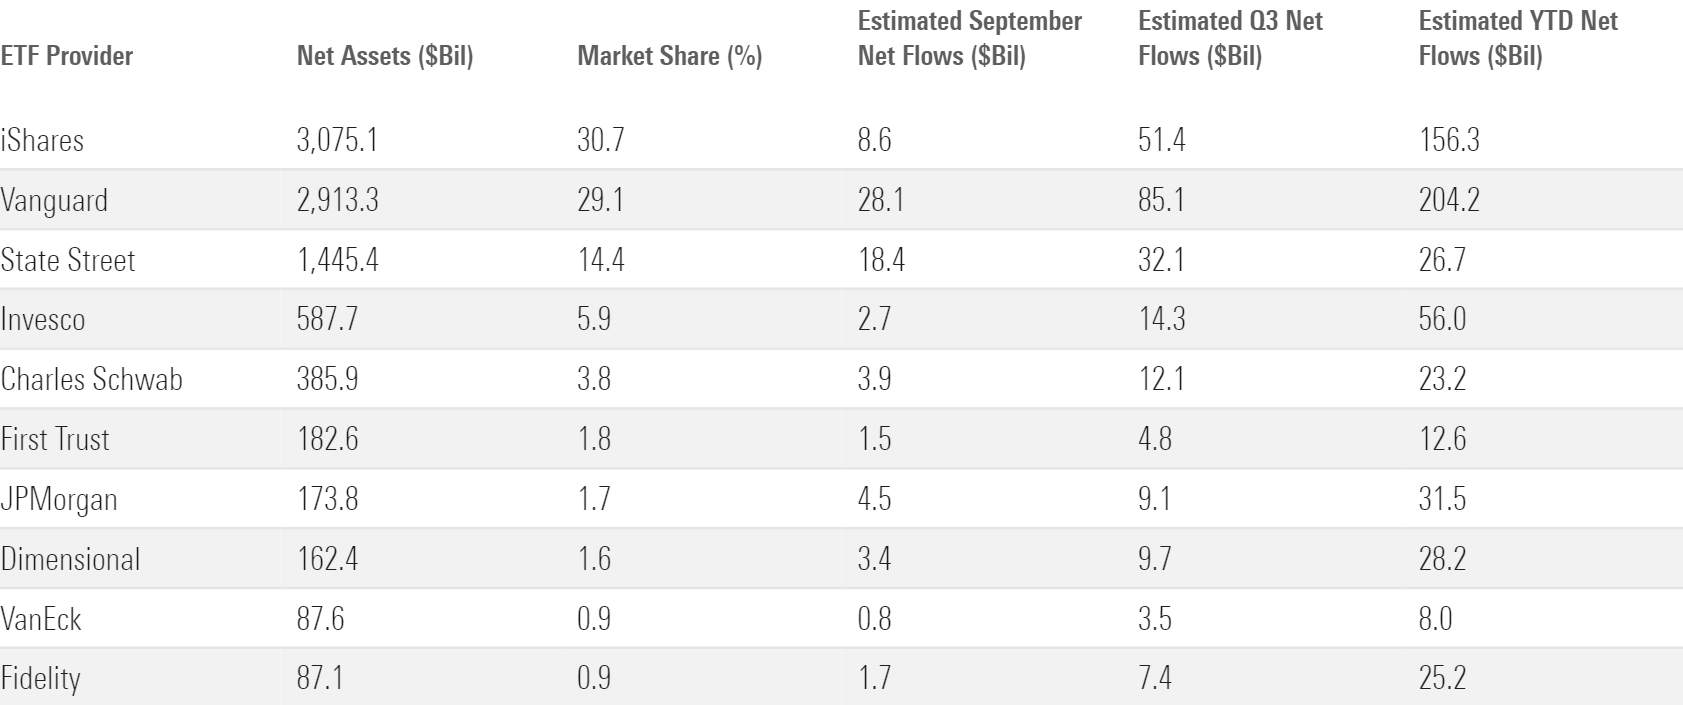
The crown jewel for Vanguard this year is undoubtedly Vanguard S&P 500 ETF. It raked in $29 billion in quarter three and has now stockpiled $71 billion of net flows over the past nine months—$20 billion more than the previous annual record. Vanguard S&P 500 ETF alone has taken in more money this year than every other fund provider except for iShares.
Vanguard’s roster of bond ETFs has contributed to its excellent year, too. Taxable-bond funds represent about 15% of the firm’s assets but gathered nearly 30% of its third-quarter flows.
As for the rest of the pack, iShares followed up its record-setting month in June with a solid third quarter. It collected $51 billion for a 1.8% organic growth rate—a perfectly fine quarter, but not enough to keep pace with Vanguard. State Street picked up third place with a $32 billion haul. It was stuck in outflows during the first half of the year, but it could finish the year strong. The difference between fourth-quarter flows and the rest of the calendar has been more pronounced for State Street than most others historically. And Invesco continued its banner year by reeling in $15 billion in the third quarter. That ticked its 2024 inflows up to $57 billion, breaking its $55-billion annual record from 2021. It will be hard for Invesco to top the 18.6% organic growth rate it notched that year, but at 12.4% through three quarters, it’s not out of reach.
The author or authors do not own shares in any securities mentioned in this article. Find out about Morningstar’s editorial policies.
/cloudfront-us-east-1.images.arcpublishing.com/morningstar/OMVK3XQEVFDRHGPHSQPIBDENQE.jpg)
/cloudfront-us-east-1.images.arcpublishing.com/morningstar/HRIVHHHVD5EKFATQH4SHWN44ZQ.jpg)
/cloudfront-us-east-1.images.arcpublishing.com/morningstar/KCFABA6O6ZCQLGMQW2TLYFEREE.png)
:quality(80)/s3.amazonaws.com/arc-authors/morningstar/30e2fda6-bf21-4e54-9e50-831a2bcccd80.jpg)