
2 Reasons to Choose Economic Moats Over Quality in ETFs
Eight undervalued wide-moat stocks that may be off ETFs’ radar.
/s3.amazonaws.com/arc-authors/morningstar/35091ad9-8fe9-4231-9701-578ec44b5def.jpg)

Beauty is in the eye of the beholder. This holds true in investing, too. Measuring the underlying quality of a business is a subjective exercise, ripe for multiple perspectives, opinions, and conclusions. Of course, there’s no “right” way to do this, but understanding the drivers behind the common historical quality factors and Morningstar’s Economic Moat Rating can help investors put their money to work in ways that align with their own definitions.
To start, why look at quality? As my colleague Ben Johnson discussed in 2019 (and others have since supported), picking stocks based on profitability, stability, and financial health has generated higher risk-adjusted returns while also providing (in some cases) better downside protection.
Over the past five years, four quality exchange-traded funds—iShares MSCI USA Quality Factor ETF QUAL, Invesco S&P 500 Quality ETF SPHQ, JPMorgan U.S. Quality Factor ETF JQUA, and Fidelity Quality Factor ETF FQAL—have returned between 10.3% and 12.2% annualized, generally in line with or ahead of the 10.4% annualized return posted by the Morningstar US Market Index (excluding the management fees each fund charges). Only QUAL has posted a downside-capture ratio of more than 100% over the same period (107.7%); by comparison, JQUA saw just 90.6% of the market’s downside.
Popular Quality ETFs Have Outperformed the U.S. Market, but Wide-Moat Performance Is Even Stronger
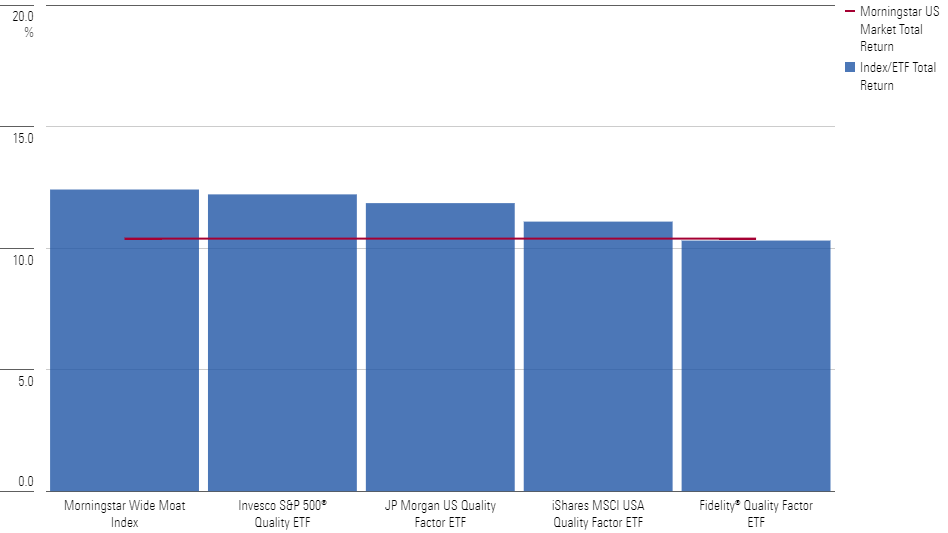
But, as the chart above shows, Morningstar’s US Wide Moat Index returned more than 12.4% annualized over the past five years, outperforming each of these ETFs.
There are two key reasons Morningstar’s equity analysts look to economic moats as a better measure of underlying company quality. And, as highlighted at the end of this article, there are stocks where Morningstar equity analysts have identified opportunities that may not be highlighted solely by looking backward, and these could be ripe for further exploration.
Difference 1: Quality Scoring Is Based on Past Magnitude, Moats Are Based on Future Durability
Morningstar’s Economic Moat methodology assesses the ability of a company to sustain its competitive advantages over a very long time frame: at least 10 years for a narrow moat, and 20-plus years for a wide moat. This is a forward-looking rating based on in-depth fundamental research that is designed to disregard market or economic cycles, investment cycles, and statistical quirks.
Each quality ETF measures quality slightly differently, looking at a variety of metrics such as return on equity or debt/equity ratio. But the common thread is that they are backward-looking. The time frames of these reviews can vary, but generally these metrics consider the past year’s worth of data, with the final compilation normalizing this to remove large outliers and build portfolios off the results.
These Quality ETFs Have Different Methodologies but Are All Backward-Looking
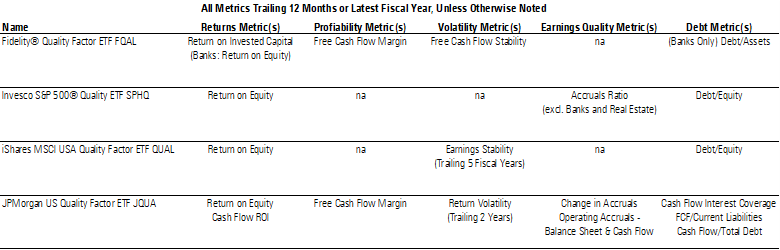
While a one-year, backward-looking measure of quality could capture the middle years of these companies’ journeys, it could also capture a flash in the pan, such as an oddly strong year or a business about to face stiffer competition.
Conversely, many companies that might not score well on recent backward-looking quality metrics can still earn a wide moat rating, given our forward-looking judgments about their prospects. Even companies with relatively low returns on invested capital can be deemed to have an economic moat if the durability of this positive spread appears persistent.
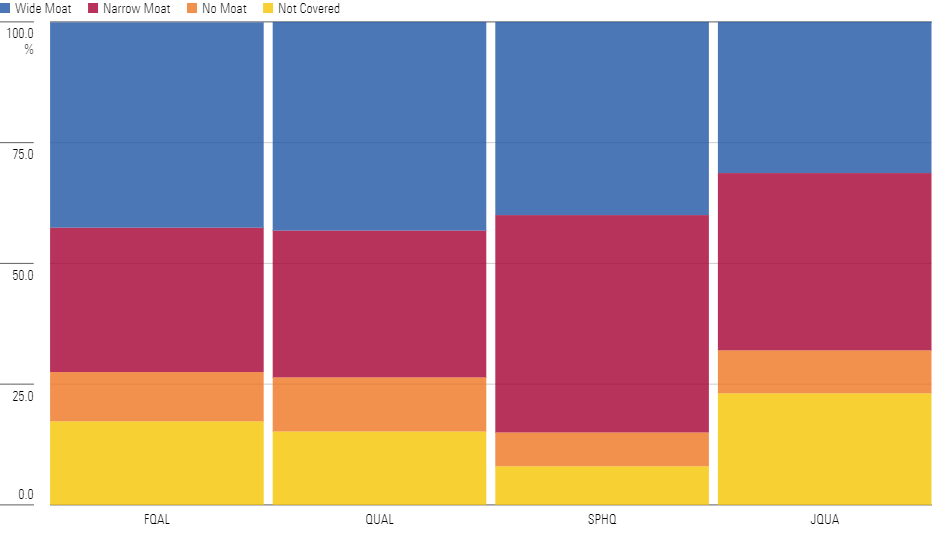
Despite the difference in processes, you might expect that there would be a strong overlap between index providers’ measures of quality and the moat rating—after all, they’re asserting similar underlying goals. But a review of the three major quality ETFs shows that each holds an average of 9% in no-moat stocks and 35% in narrow-moat stocks as of June 30, 2023.
Quality ETFs Hold More Than Just Wide-Moat Stocks
Difference 2: Quality Measurements Can Skip Industry-Specific Considerations
While some index providers, such as MSCI, Fidelity, and J.P. Morgan, compare companies’ quality against peers in similar industries in their relevant indexes, others—including Morningstar—do not. This can lead to companies in sectors with naturally more-limited profitability receiving a lower score, even if those firms have carved solid competitive advantages over their direct peers, while capital-light companies can be artificially elevated, despite often being most at risk for competition to quickly erode returns.
Take, for instance, the utilities sector. Companies in this space are often regulated, which keeps their return on equity low versus other industries but typically above their cost of equity to incentivize ongoing capital-intensive maintenance and growth expenditures. Meanwhile, utilities typically take on a sizable amount of debt to maximize equity profitability for their shareholders. Both issues mean that these stocks are likely to screen poorly on a backward-looking measure of quality that makes no sector adjustment. Using Morningstar’s own quality factor scoring—an average of return on assets and debt/capital ratio — utilities receive an average score of negative 0.51 (zero being approximately average within a geography), the worst among Morningstar’s equity research coverage. Yet more than half of the companies covered by Morningstar are awarded a wide or narrow moat rating.
On the other hand, companies in the energy sector within our equity research coverage have very high average quality scores: positive 0.33, according to Morningstar’s quality factor. This is largely a result of record commodity prices during the past 18 months driven in part by Russia’s invasion of Ukraine. However, per our equity research team, carving durable competitive advantages in this space is difficult given the dominant effect of volatile fossil fuel prices on firms’ bottom lines. Only 38% of covered companies in this industry have been assigned an economic moat: 30% narrow and 8% wide.
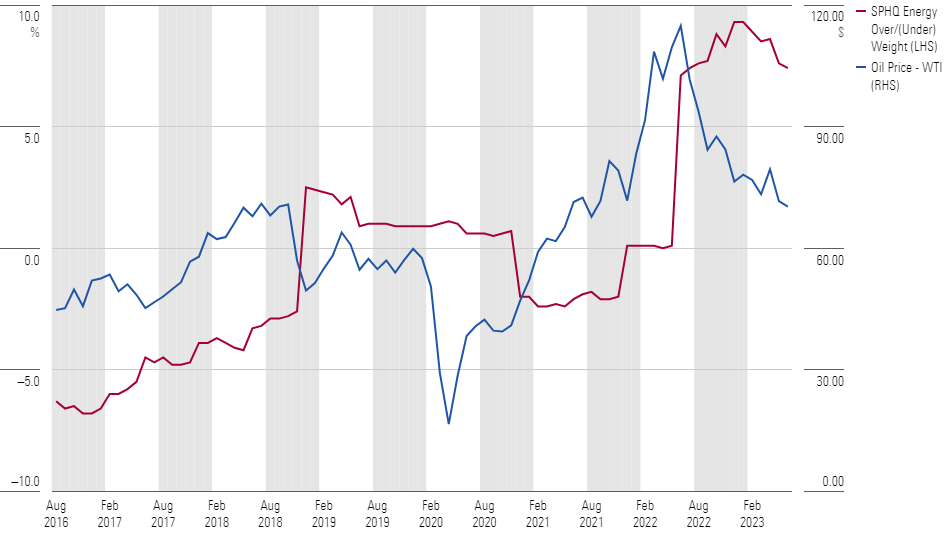
It’s no wonder, then, that SPHQ—which, like the Morningstar moat indexes, is sector-agnostic—currently holds more than 12% of its assets in energy companies, considerably higher than the 4% found in the Morningstar US Market Index. This stake accounted for less than 1% of the ETF’s portfolio in September 2016, when oil prices were considerably lower (at the time, energy was 6.5% of the Morningstar US Market index). The sole use of historical results to pick stocks in a cyclical industry can lead to buying high and selling low. In this case, it results in a bet on continued high oil prices, not necessarily quality companies.
SPHQ's Relative Energy Weighting Has Followed Oil Prices
Moats in Action: Don’t Forget About Valuation
Of course, past performance is not a predictor of future returns. There’s no guarantee that companies with wide moat ratings will continue to outperform those deemed to be high-quality by other methods. Further complicating this comparison, the Morningstar Wide Moat Index is not directly investable. And importantly, none of these funds or indexes consider the valuation of a stock—investors risk overpaying for quality by any measure by ignoring prevailing market prices.
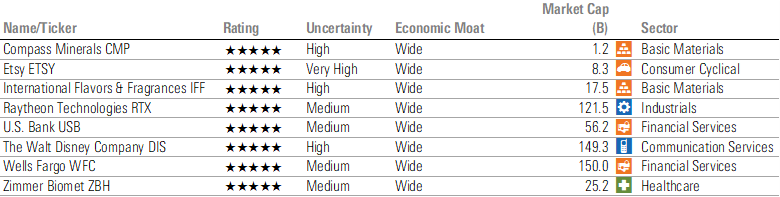
With that in mind, investors keen to zig where others may zag can look to undervalued wide-moat stocks that aren’t held by any of the four quality ETFs mentioned above. There are eight such names trading in 5-star territory that may be worth looking into.
These 5-Star Wide Moat Stocks May Be Off the Radar of Quality ETFs
3 Most Expensive Wide-Moat Stocks to Avoid
The author or authors own shares in one or more securities mentioned in this article. Find out about Morningstar’s editorial policies.
/cloudfront-us-east-1.images.arcpublishing.com/morningstar/4JOND5R2SBFPZE63XWPYQDG56A.png)
/cloudfront-us-east-1.images.arcpublishing.com/morningstar/K36BSDXY2RAXNMH6G5XT7YIXMU.png)
/cloudfront-us-east-1.images.arcpublishing.com/morningstar/BG4IFJHA25B6RKD3XNUYKROBBM.jpg)
:quality(80)/s3.amazonaws.com/arc-authors/morningstar/35091ad9-8fe9-4231-9701-578ec44b5def.jpg)