
- Fund flows measure changes in newly purchased or redeemed shares over a certain period.
- Recent performance, expense ratios, and firm reputation can affect fund flows.
- In theory, asset flows should move in the same direction as security prices. But, this doesn’t always prove true.
The Ultimate Guide to Fund Flows
Read Time: 10 Minutes
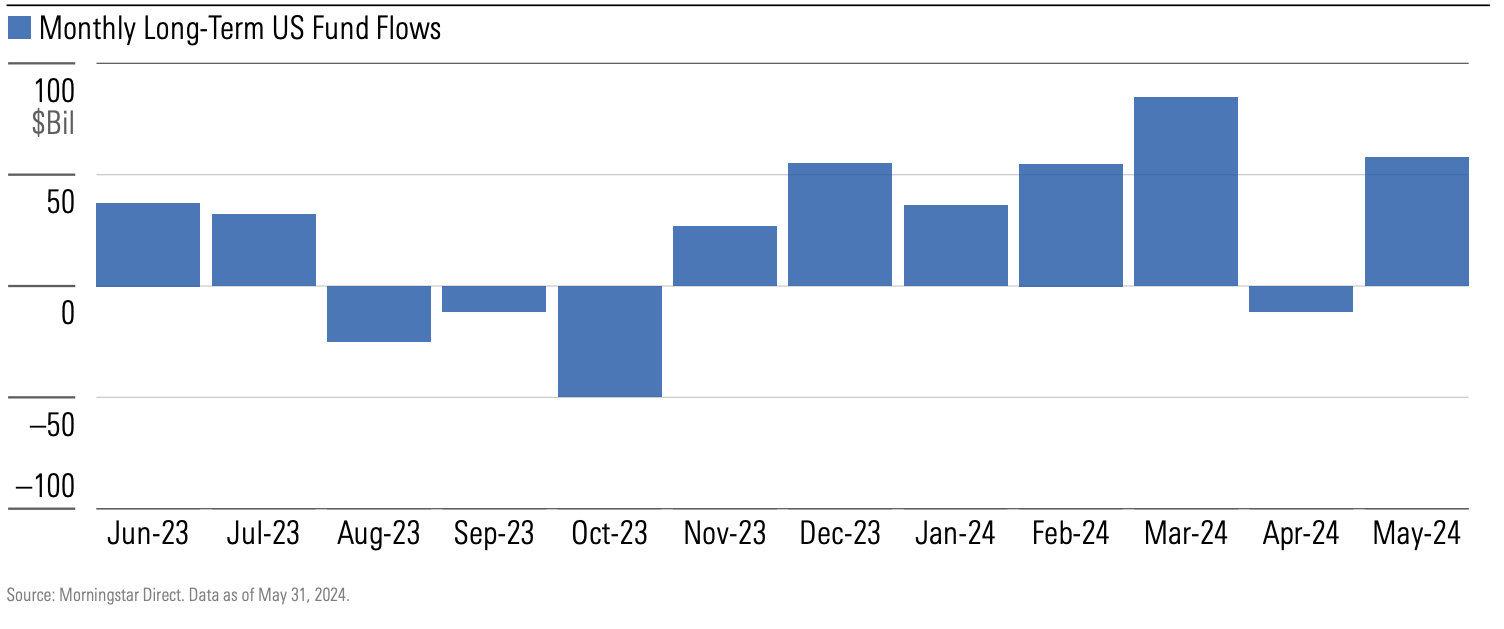
Two bullish signals emerged from investors’ decisions in the first quarter of 2024.
After 17 months of “risk off” inflows, money-market funds turned to outflows in March. The change may indicate a switch to “risk on” attitude among investors.
Quarterly allocations to equity strategies reached a 15-year high, thanks to swelling stock returns and, to a lesser extent, $76 billion of inflows to equity funds and ETFs.
Fund flows show a wide-angle view of how investors and financial advisors behave. They can reveal patterns that reflect investor sentiment and contextualize emerging asset management trends. How do investors react to market swings? Why do investors buy some products and not others?
In this ultimate guide to fund flows, we outline how asset managers can take the pulse of the competition.
Position Investment Products With Flows Data
Since 2002, more than 3,000 share classes were launched each month. In a seemingly ever-expanding pool of investment options, asset management firms need a way to showcase their products’ strengths.
Fund flows illuminate shared characteristics of growing investment vehicles that can validate your positioning.
If investor interest in ESG holds steady, firms could consider highlighting how they use environmental, social, and governance criteria. If one type of fund is flourishing in one region but stalling in another, firms might rethink where they concentrate their promotional efforts.
You can use this rich global data to:
- Find categories that attracted the most inflows.
- Understand who’s buying from your competitors: institutional investors? Retail investors on the direct market?
- Analyze how your products stack up against influential flow factors.
- Predict impending fund shutdowns.
- Monitor pivots in your competitors’ product strategy.
Free Download Library
Report

Global Equity Fund Flows
Take a deep dive into global fund families.
Report

Fund Flows Commentary
Review monthly fund flow data. This Morningstar mutual fund report covers flows in the United Kingdom, United States, European markets, and Japan.
Report

Global Sustainable Fund Flows
A quarterly overview of sustainable fund flows.
Guide

A Guide to Asset Flows
A step-by-step walkthrough on using asset flows data.
Report

European Sustainable Fund Flows
Quarterly fund flows, fund launches, and regulatory updates.
Guide

Guide to Thematic Funds
Learn about global thematic fund survival and performance trends.
Key Takeaways
How Does Morningstar Measure Fund Flows?
Fund flows measure changes in newly purchased or redeemed shares over a certain period. Fund flows don’t measure changes in price.
To calculate net flows, Morningstar uses an industry-standard approach. Our team compares a fund’s total assets under management at the beginning and end of a period. Researchers back out price changes, distributions, and reinvested dividends to exclude them from net flows. From there, analysts adjust for infrequent corporate actions such as reverse share splits.
Asset flows data intends to show shifts in investor preference with movement between noticeably different investment strategies. When possible, Morningstar offsets outflows caused by movement to another fund with an identical mandate.
To calculate the organic growth rate and show fund flows as a percentage, analysts divide net flows by the total assets under management at the beginning of the period.
Morningstar’s approach assumes that fund flows occur at the same rate over the course of the month. While fund flows are estimates, the difference from the precise total is often negligible. Morningstar will overwrite our estimates with data from managers when available.
Source: Morningstar Direct Asset Flows. Data as of May 31, 2024.
What Factors Affect Fund Flows?
Morningstar analysts compared mutual fund flows data from 2003-14 and 2015-18. Some variables consistently lined up with investor preferences:
- Strong performance.
- Low fees.
- Positive firm reputation (measured by metrics like the Morningstar Analyst Rating).
- Recommended by independent rating agencies.
- Consider ESG criteria.
- Indexed.
Do fund flows drive stock prices?
In theory, asset flows should move in the same direction as security prices.
When investors put more cash into mutual funds, asset managers can buy more stocks and bonds, driving prices up for the fund itself. The opposite should also hold. When investors redeem or sell mutual-fund shares, asset managers sell off underlying securities, often depressing prices.
But this rule doesn’t always prove true.
Asset flows sometimes go against security prices. In 2020, US equity funds suffered outflows even when the market surged. The pace of individual transactions can affect how prices respond.
Related Products and Services

Solutions for Marketers
Elevate your brand by showcasing your value, driving effective engagement, and creating great reports with ease.

Morningstar Direct
Advanced portfolio analytics and performance reporting.

Research Portal
Independent evaluations of equities, funds, and managed investment products.
Key Takeaways
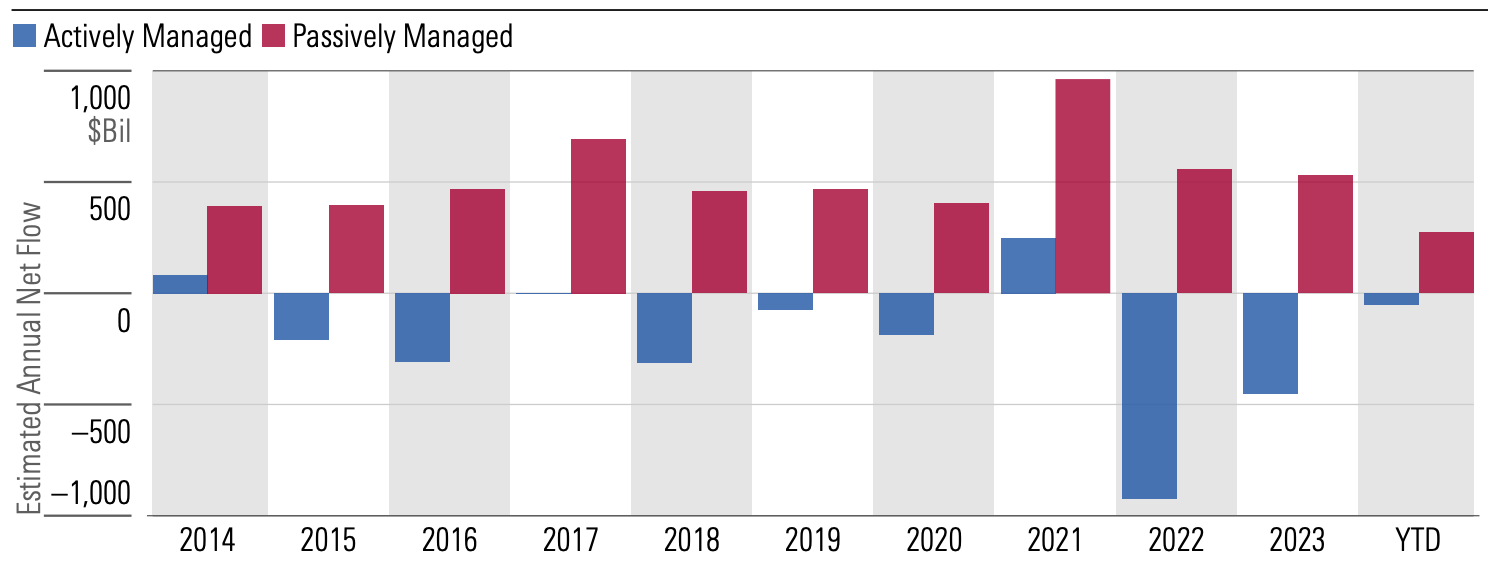
- Fund flows reveal a tidal shift in active vs. passive funds.
- Active funds have lost cash every year since 2015, while indexed ETFs continue to gain market share.
- Fund flows don’t always line up with security price changes.
What Are the Types of Fund Flows?
With the right analysis, fund flows information can tell a larger story about investors.
Passive vs. active fund flows
Over the last two decades, the U.S. market has undergone a tidal shift from active to passive investment vehicles. Market lows, when valuations drop, create a crunch for mutual fund managers who generate asset-based fees.
Asset flows can illuminate corners of the market where active management continues to drive mutual fund inflows. The choice between an active and passive investment strategy is a personal one. Asset flows by distribution channel can help understand the target audience of each approach.
Global fund flows
Fund flows by domicile show how investor behavior differs by country.
With detailed global data, asset managers can make informed decisions on upcoming product launches.
Flows by fund family
Fund family flows roll up all the funds by brand name for a big picture look at competitor performance.
Grouping flows by fund family can illustrate gaps in competitor coverage. You can see patterns in new product launches and pending fund shutdowns.
Morningstar Category fund flows
Category fund flows offer a detailed lens for analyzing investor preferences. The Morningstar category reflects the underlying securities, not the prospectus. In the United States, Morningstar organizes funds into 122 categories that map to nine category groups.
Fund Flows by Asset Class
Because funds can contain a range of products—bonds, stocks, alternative assets—fund flows also shine a light on how investors feel about the underlying asset classes.
What investments can weather market headwinds and tailwinds?
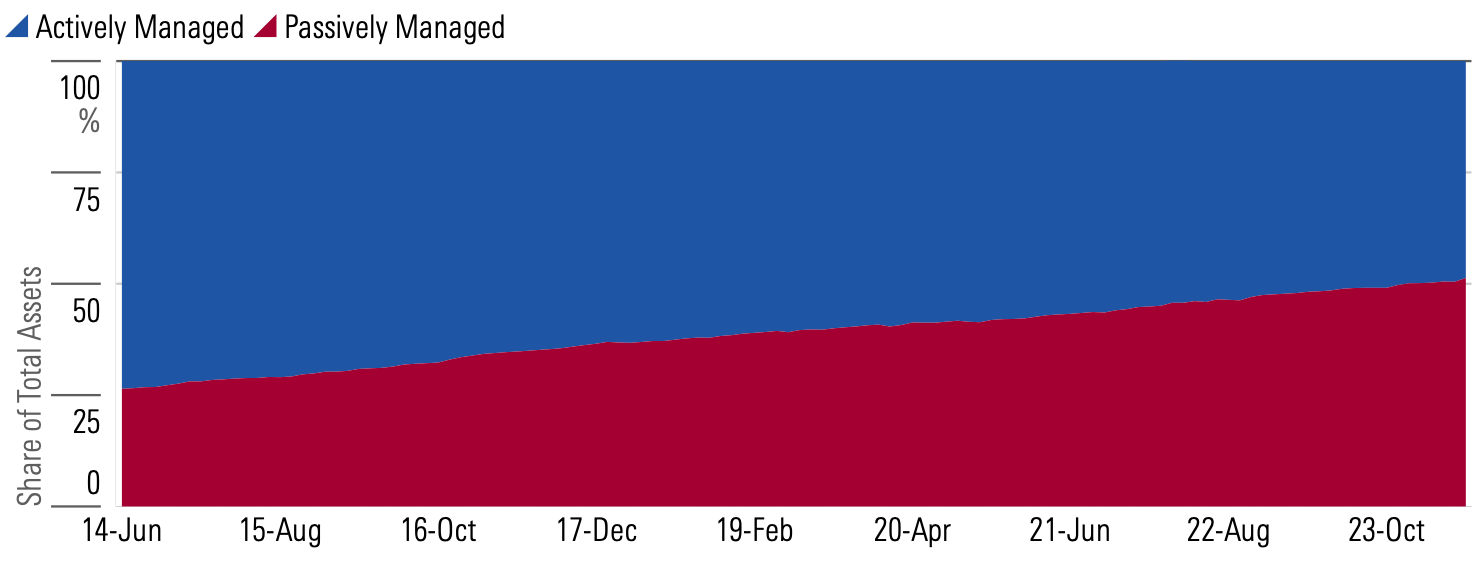
Passive fund flows overtake active ones
In early 2024, passive funds overtook their active counterparts in assets under management for the first time.
Today the exchange-traded funds industry is dominated hyper-scaled beta providers; the top three alone control 66% of the USD 12 trillion in global ETF assets. But none of the giants are standing still.
The growth in active ETFs defies the broader shift toward passive investing. Active ETFs give investors the benefits of lower expense ratios, transparent pricing, and easy liquidity, paired with the intervention of asset managers.
Active ETFs defied the broader shift toward passive investing.
While they hold a smaller market share, active ETFs have posted an annual organic growth rate of over 25% since 2015.
Capital Group has emerged as one of the key winners in the active ETF race. Since launching its first active ETFs in February 2022, the firm has amassed nearly $25 billion in flows across its suite. May 2024 was the suite’s best month of flows yet, with a nearly $2.5 billion intake.
Alternative funds hold investor attention
Alternative funds diversify portfolios with exposure to different risk factors than stocks and bonds. Some look for growth in any market conditions. Others provide exposure to specific events with their own flavor of risk. Others function like bonds, aiming for small but consistent returns.
Investors can miss out on the defensive benefit of alternative funds by waiting until other investment vehicles suffer before investing.
Alternative funds grew popular in 2020 and 2021 when interest rates were low, and the stock market was booming. In 2022, when asset valuations in the traditional market began to flag, they collected over $25 billion but lost momentum by year-end.
Exchange-traded funds expanded their share of the liquid alternatives market from 6% to 47% over the five years ended May 2024.
Two main developments explain the rise.
The first was the advent of defined-outcome, or “buffer” ETFs, whose downside protection vaulted them into the mainstream after the early-2020 pandemic-fueled drawdown.
The second was the early-2024 launch of bitcoin ETFs—an immediate sensation that drove alternative ETFs to new heights.
Inflows ebb for fixed-income funds
Investors rebalanced from equity to fixed income during the coronavirus bull market, but equity funds’ share of the global investor portfolio has swelled thanks to 2023’s bull market among global mega-caps and strong returns in the first quarter of 2024.
The likelihood of further rebalancing from equity to fixed income is moderately high given past investor behavior.
Investors have piled into taxable-bond funds of all stripes.
Seventeen of the 23 taxable-bond Morningstar Categories have notched inflows so far in 2024. Several of those categories oppose one another: ultrashort- and long-term, government and high-yield corporate, global and US-only have all made out well. Short-term and inflation-protected funds are the outliers, but even their outflows are far milder this year than last.
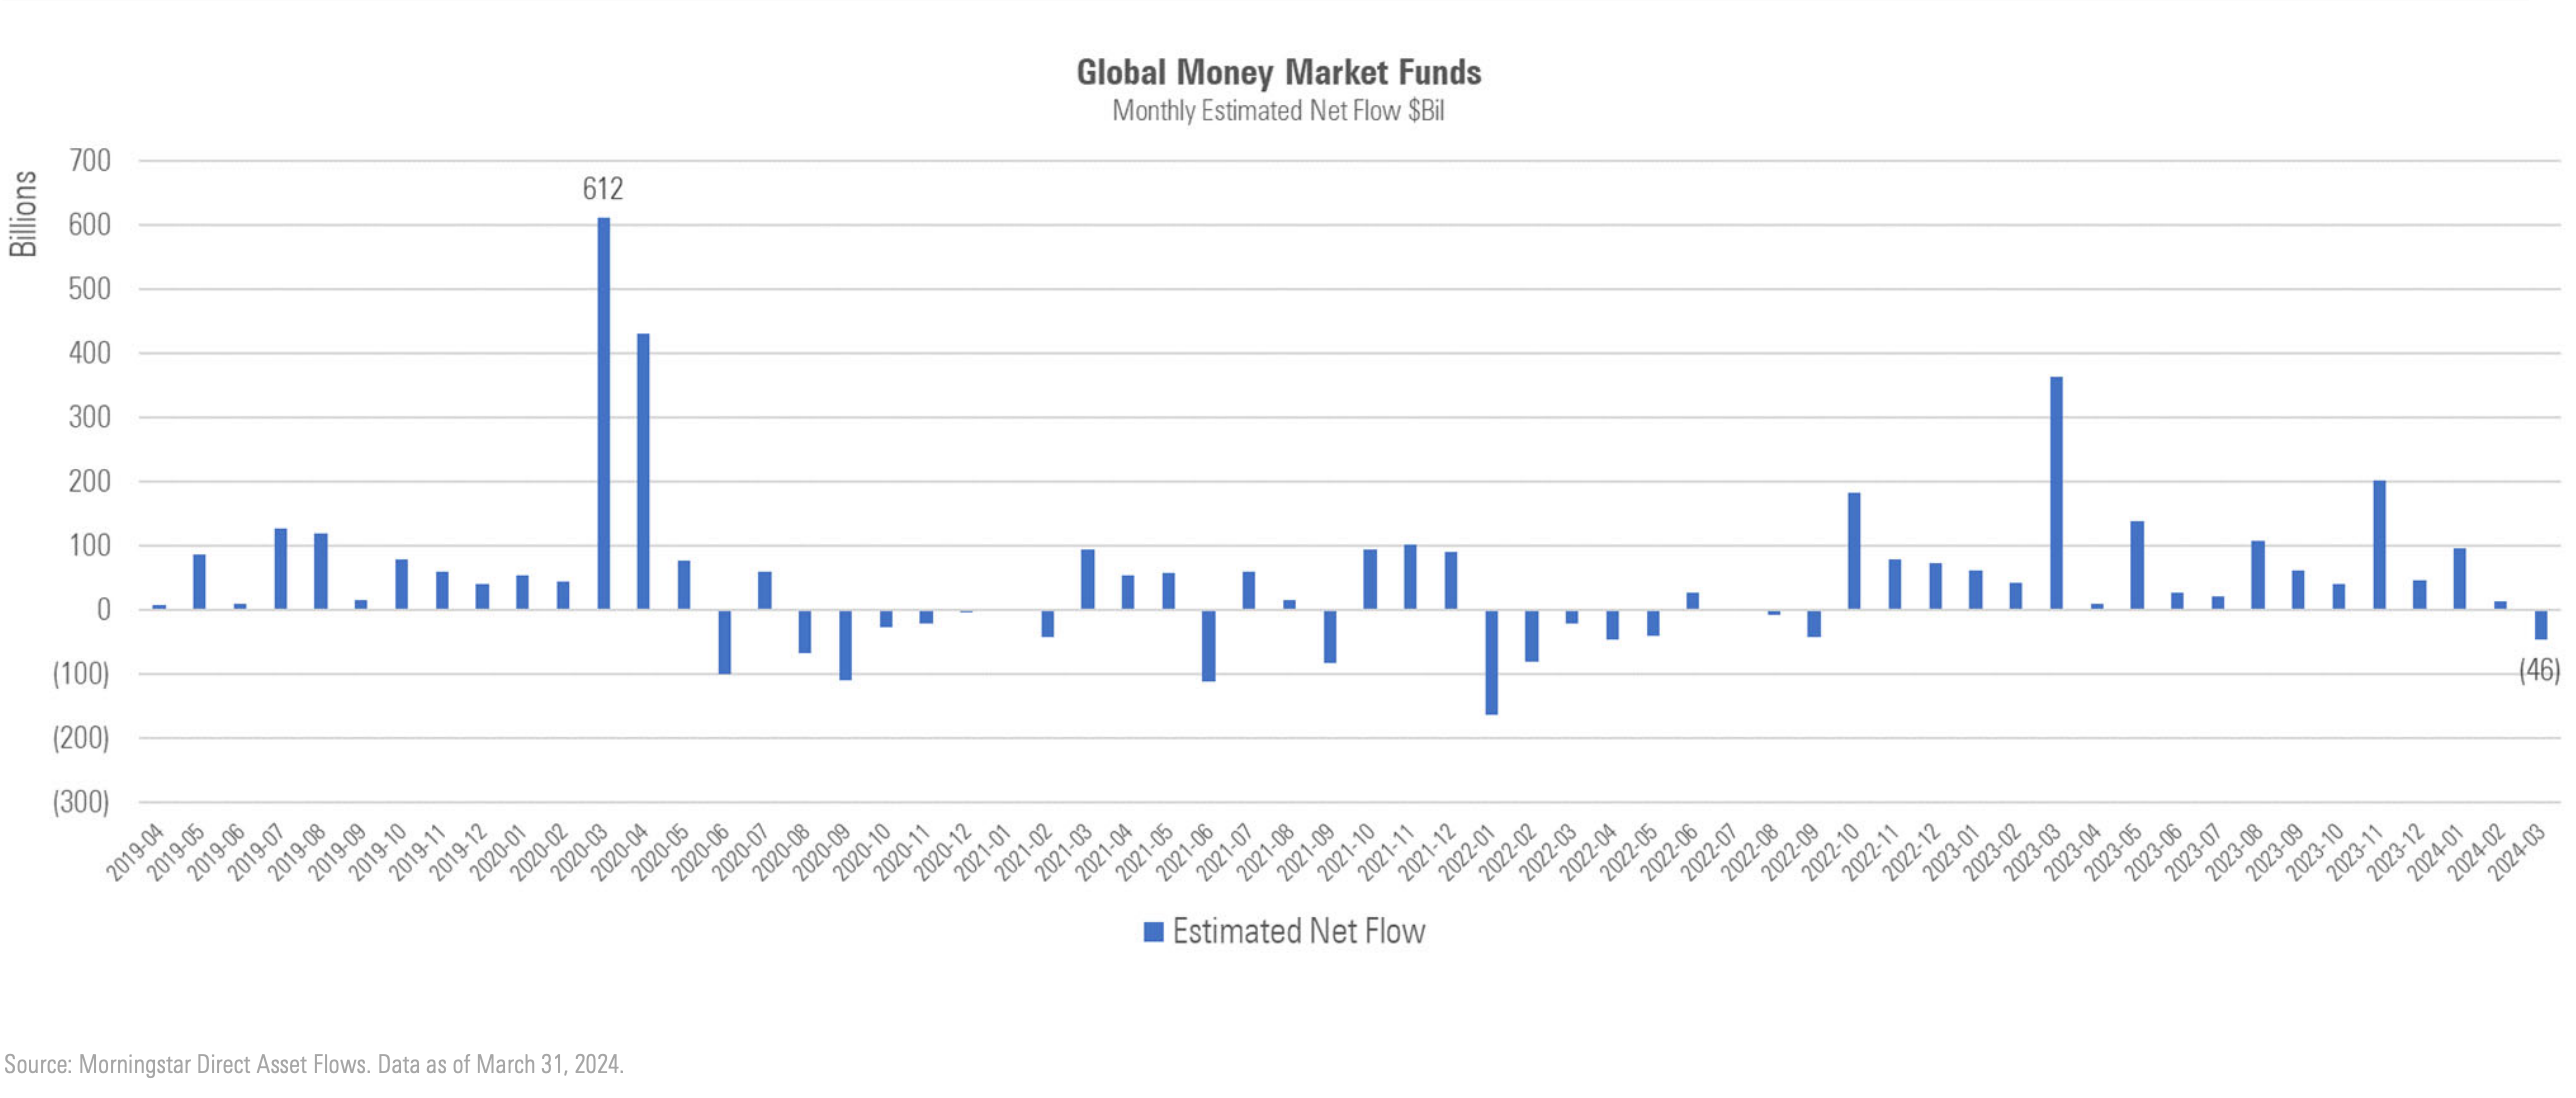
Money-market flows turned negative in March, but remain at a historically normal level
After 17 months of risk-off inflows, global money market funds turned to $46 billion of outflows in March, indicating a more sanguine attitude toward risk. Over that streak, category funds enjoyed $1.6 trillion in inflows.
Despite these outflows, total assets in money market funds reached an all-time high of $7.8 trillion. The United States is home to 71% of global money-market assets, while cross-border domiciles hold 17%. Other markets account for the remaining 12%.
Money-market funds globally took in $1.1 trillion in 2023 but had $46 billion of outflows in the first quarter of 2024. Total assets reached a record $7.8 trillion.
Stock market bulls believe trillions in these funds will be put to work in stocks in 2024, but money markets’ share of long-term assets is still moderate on a historical basis, and money-market yields are still attractive.
Key Takeaways
- Asset flows show that ESG criteria are essential for many investors, even in downturns.
- Overall, today’s investors think long-term about their financial goals.
- Propelled by an interest in lower fees, investors have sought out index funds at growing rates.
Fund Flows in Charts
ESG investing trends
Environmental, social, and corporate governance investing has reached the mainstream. But after years of market turmoil, will investors hold on to their sustainable investments? Do they think of ESG criteria as “nice-to-haves” or essentials?
Asset flows give us context.
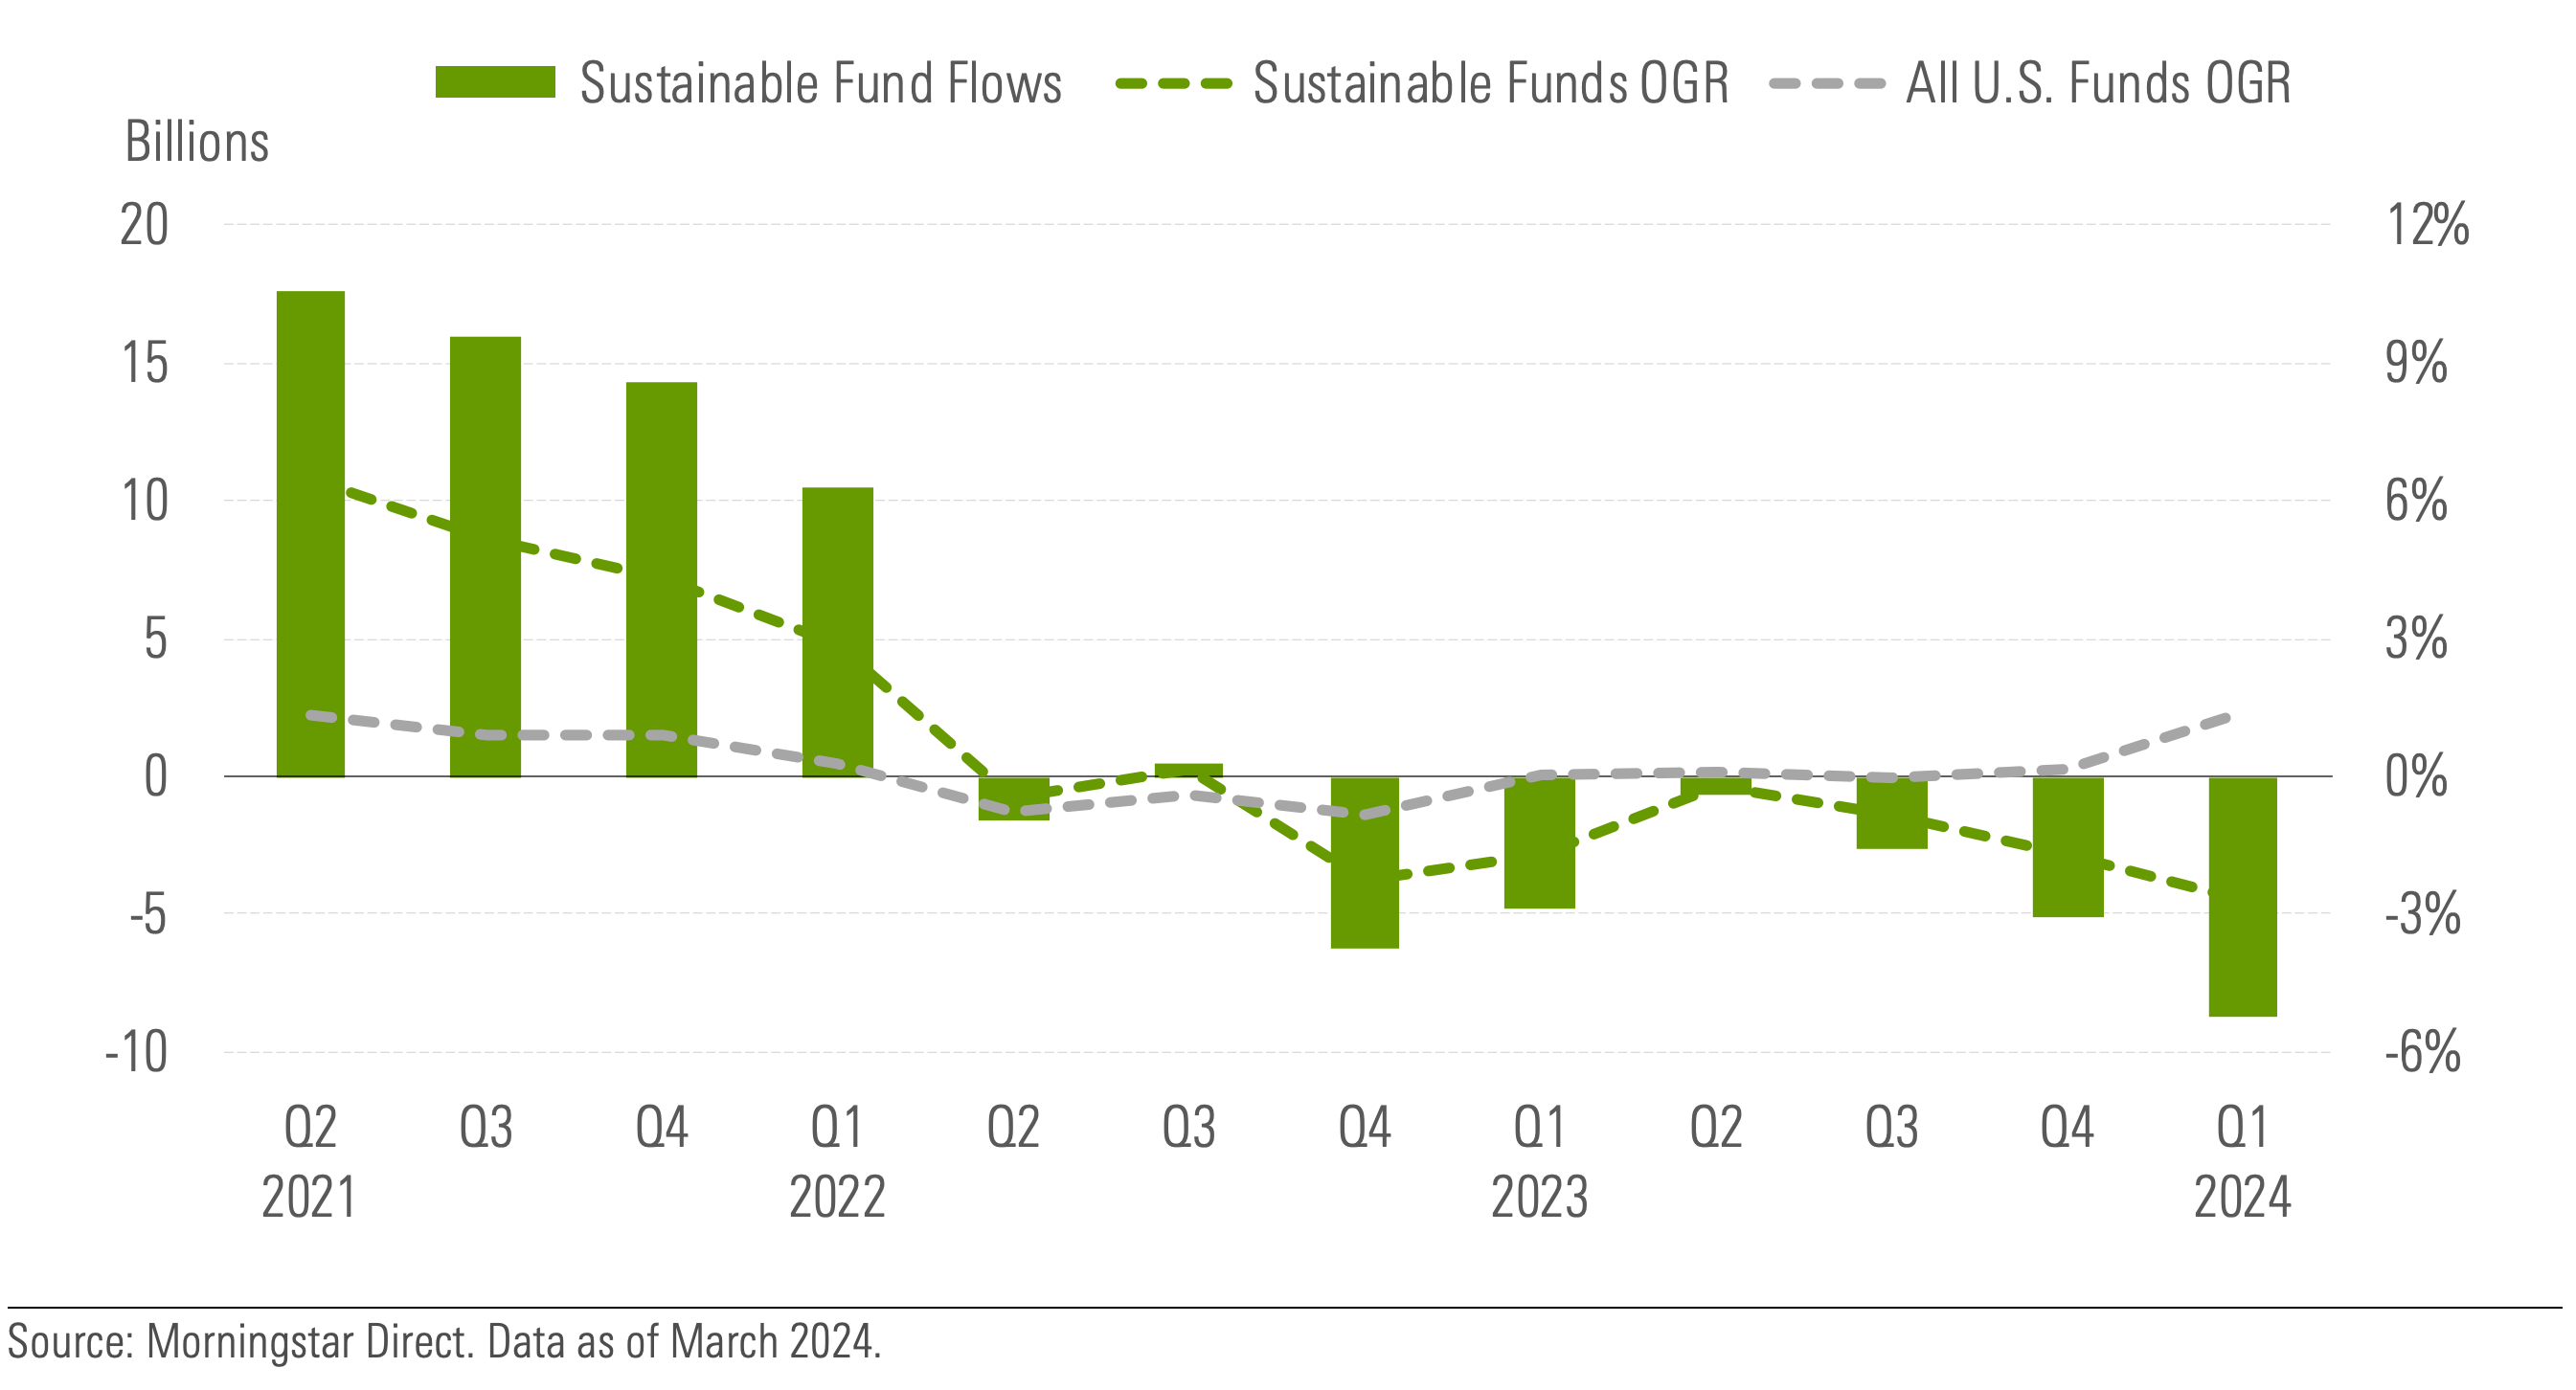
In the first quarter of 2024, the global universe of sustainable open-end and exchange-traded funds rebounded slightly by attracting nearly $900 million of net new money.
In contrast, the United States experienced its worst-ever quarter with record redemptions of USD 8.8 billion.
In the first quarter of 2024, the decline in global fund launches continued, reaching an unprecedented low of 97 new sustainable funds introduced worldwide.
Investor allocation to equity strategies hits a 15-year high
Investors rebalanced from equity to fixed income during the coronavirus bull market. However, equity funds’ share of the global investor portfolio has swelled thanks to 2023’s bull market among global mega-caps and strong returns in the first quarer of 2024.
In fact, the first quarter’s 54.0% allocation to equity funds was higher than any quarter since Q1 2009. The previous high was 53.3% in Q4 2021.
Assets in equity strategies reached $29.5 trillion, also a record. The likelihood of further rebalancing from equity to fixed income is moderately high given past investor behavior.
Source: Morningstar Direct Asset Flows. Data as of March 31, 2024.
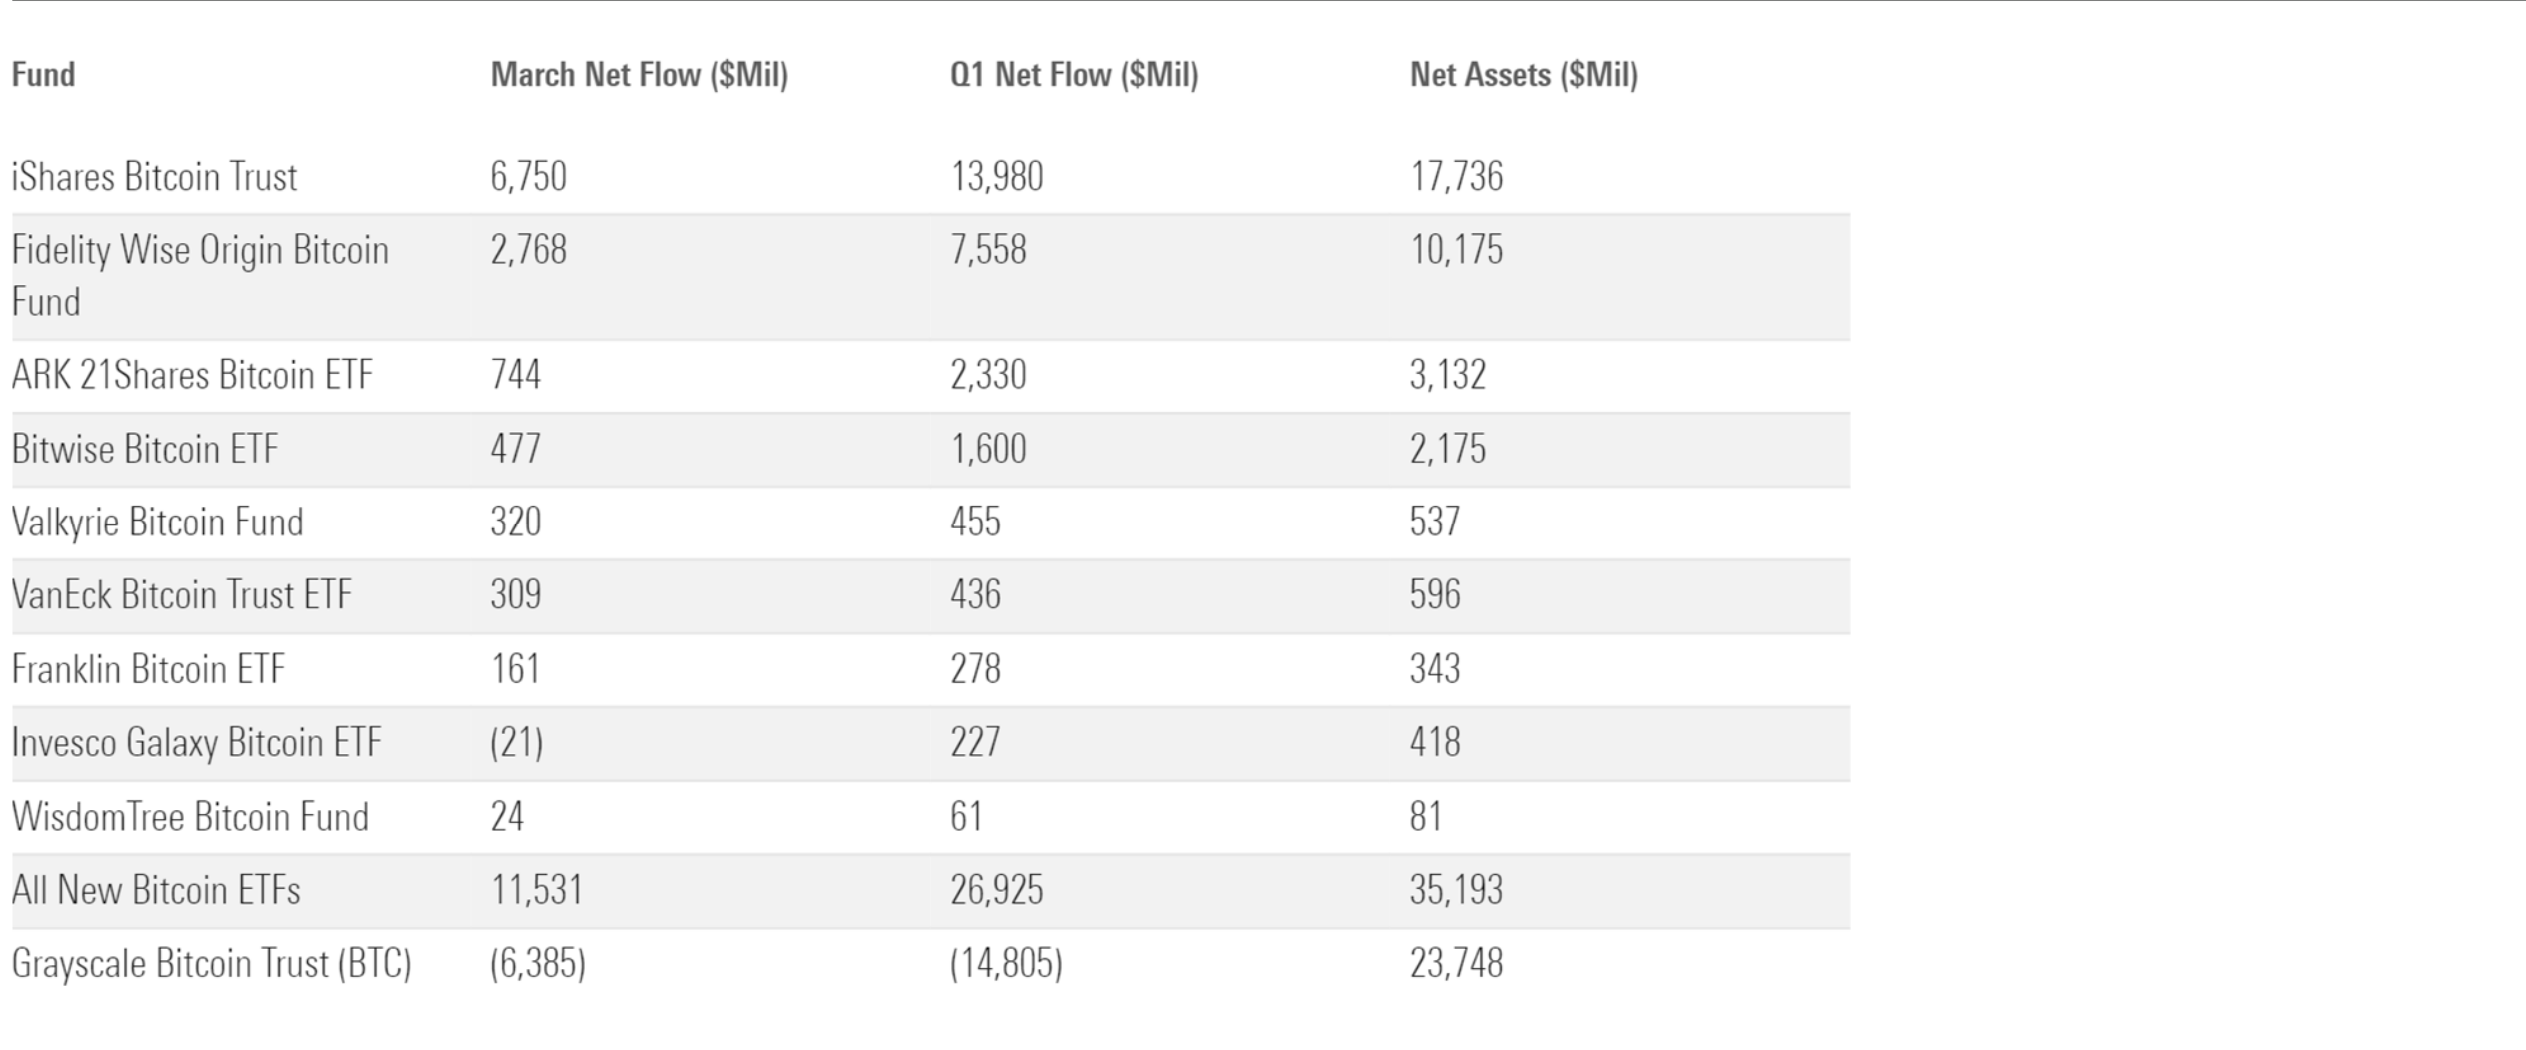
Spot bitcoin ETFs arrive with a bang
IShares Bitcoin Trust ETF and Fidelity Wise Origin Bitcoin ETF elbowed their way onto the list of top-flowing funds globally. This group is typically dominated by the largest funds, most of which are passive equity funds based in the United States.
Nine spot bitcoin ETFs launched in the United States in January. They gathered $27 billion in the quarter. The quick success of these vehicles has catalyzed interest in offering similar vehicles in developed markets everywhere, though Canadian and Brazilian investors already had access to spot bitcoin ETFs.
Where Can I Find ETF Fund Flow Data?
In Morningstar Direct, asset management firms can dig into the underlying data to contextualize the market. Every month, a Morningstar mutual funds report recaps U.S. trends. Our researchers publish a global retrospective each year.
Report

2023 Global Equity Fund Flows
Take a deep dive into global fund families.
How Can Asset Managers Use Fund Flows Information?
Flows can help inform marketing as a window into investor preferences. Do investors choose funds based on their recent performance or low expenses? How can fund managers position their products in line with investor expectations?
Asset flows can also help firms prioritize which funds to promote in what regions. Shift resources to products that reflect investor interest.
Fund flows shed light on AUM trends across major fund families. Find gaps in the competition and discover ways to differentiate your firm.
Asset Flows in Morningstar Direct
Morningstar Direct gives users the data, research, and analysis they need on over 600,000 collective investments. In the platform, asset managers can show how their investment stories relate to the broader markets, compare products with the competition, and present their findings in compliance-friendly reports.
Morningstar’s asset fund flows data dates to 2008, with forecasting models for future growth rates. Direct includes all fund flows data at one price with its performance reporting, presentation, and search capabilities. The Direct team also supports new users with onboarding, training materials, and 24-hour customer service.
Customize your fund flows research. Schedule a demo today!