
What a ‘Stock-Picker’s Market’ Really Means
And the challenges it presents for active managers.
/s3.amazonaws.com/arc-authors/morningstar/360a595b-3706-41f3-862d-b9d4d069160e.jpg)

The notion that sometimes the market is driven by a rising tide that lifts all boats seems plausible. If most stocks are generating gains, you might conclude that all you have to do is stay fully invested. At other times, there’s a bigger gap between the market’s winners and losers. During such times, the thinking goes that a talented portfolio manager can add more value by picking the best stocks and avoiding the worst.
There is some evidence to support this idea. During periods when there’s more distance between the best- and worst-performing stocks, a larger percentage of managers tends to outperform. On average, however, the typical active manager still ends up in the same place in either case: behind the fund’s benchmark.
Digging Through the Evidence
The Wall Street Journal’s Jason Zweig recently looked at a similar question. Using Morningstar data, he found that only 18% of actively managed funds that measure themselves against the S&P 500 outperformed that benchmark in the first half of 2024, even though implied correlations for stock returns have been relatively low. He also found that on average, only about 27% of such funds beat their benchmarks over the past 10 years.
I expanded on this analysis to see if there was any relationship between the dispersion of returns (the gap between the market’s winners and losers) and how well active managers fared. To measure dispersion, I calculated the interquartile range (the gap between the 25th percentile and the 75th percentile) of calendar-year returns for stocks included in the S&P 500. The bigger the interquartile range, the higher the dispersion of returns. In markets with greater dispersion, a talented active manager should theoretically add more value.
The dispersion of returns (shown in the blue bars below) ranged from about 24% on the low end to more than 62% on the high end. Dispersion was highest during periods of market turmoil, such as the tech-stock correction in the early 2000s, the global financial crisis in 2008 and 2009, and the pandemic-driven downturn and subsequent rebound in 2020 and 2021.
An Uninspiring Picture
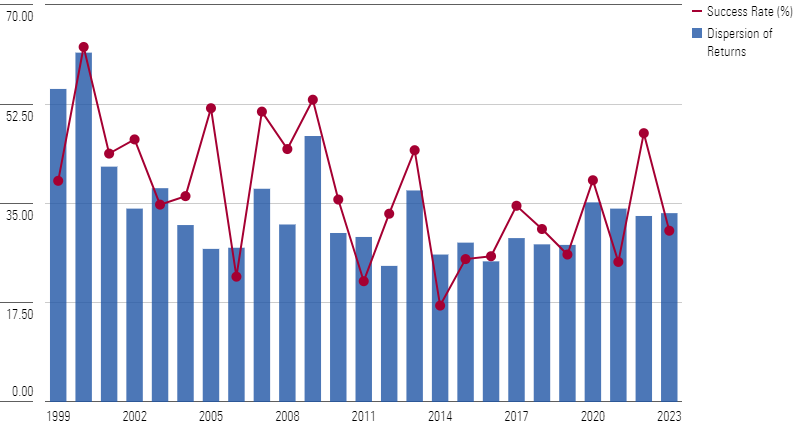
Why Picking Top Stocks Is Not Enough
Following in Zweig’s footsteps, I then looked at performance for actively managed stock funds that use the S&P 500 as their primary benchmark. The results weren’t encouraging. The percentage of funds that beat their benchmarks (shown in the red line above) was below 50% in 21 of the past 25 calendar years. On average, only about 37% of these funds came out ahead of the index in a typical calendar year.
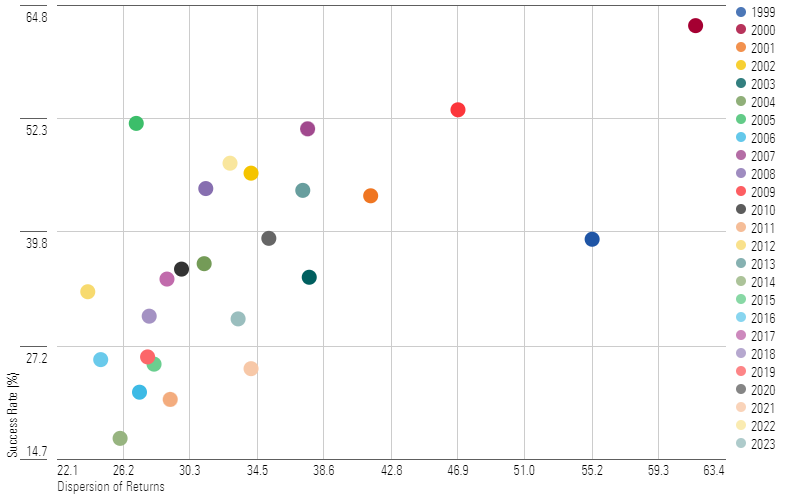
However, there is a positive relationship between return dispersion and the success rate of actively managed funds, as shown in the scatterplot below. But it’s not a perfect relationship, as the R-squared of 0.41 between these two factors indicates.
Dispersion of Returns vs. Active Manager Success Rates
These results are in line with Morningstar’s annual Active/Passive Barometer study, which found that a minority of actively managed funds have fared better than their passively managed peers across most fund categories. This result held true even when the study’s authors looked at asset-weighted returns, which are a better reflection of the typical fund investor’s experience.
Granted, some portfolio managers are more talented than others. Morningstar’s batting average—which measures the percentage of rolling 12-month periods a fund has beaten its benchmark—is one way to measure this. The table below highlights some funds that score well on this measure.
A Few Good Stock-Picking Funds
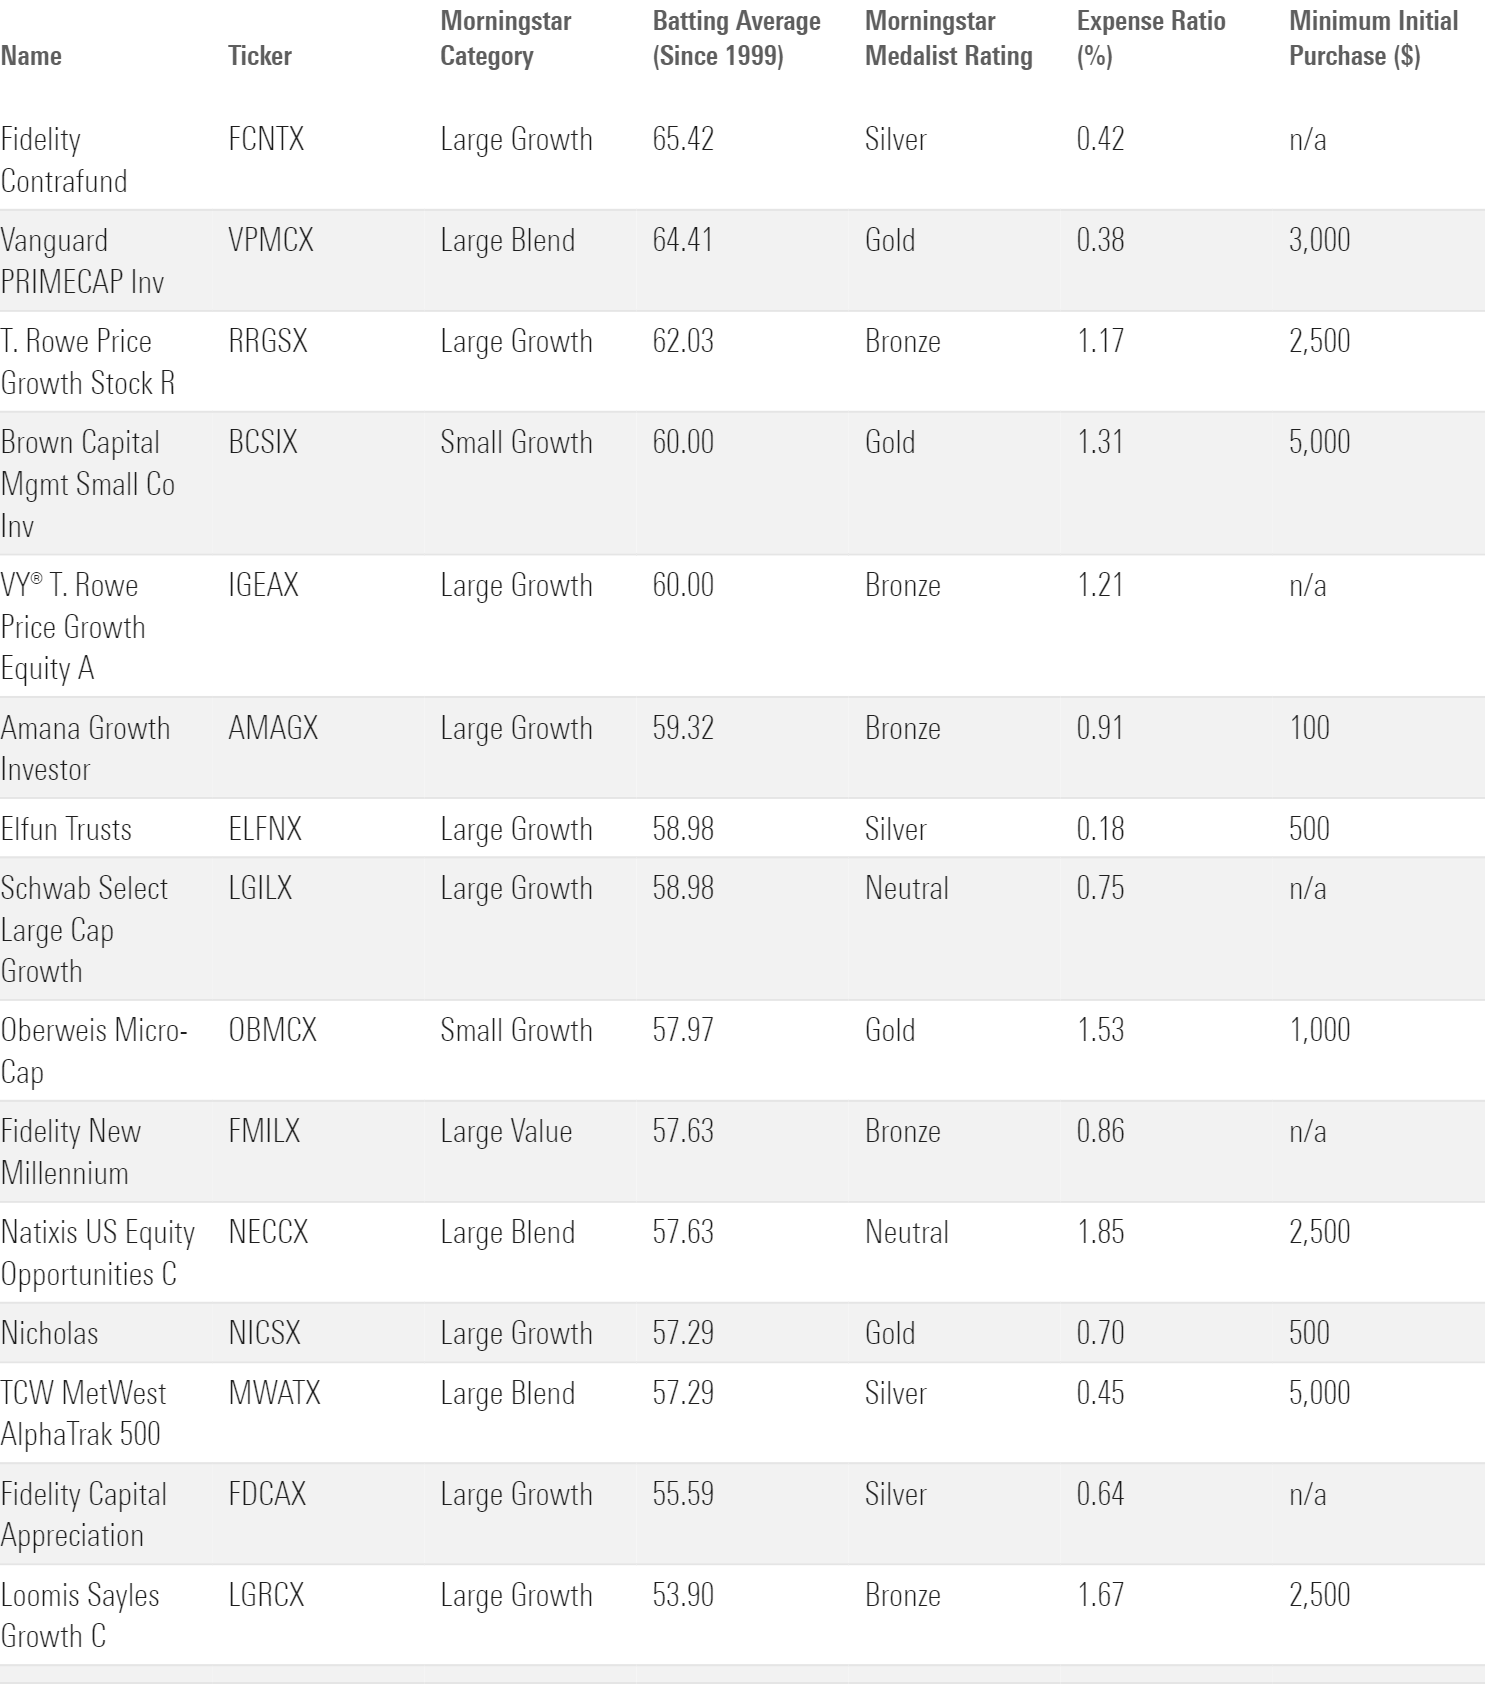
The problem: It’s difficult to identify managers who can consistently outperform ahead of time.
Conclusion
Being in a stock-picker’s market is one thing, but consistently taking advantage of it is challenging. When you hear “it’s a stock-picker’s market,” what that really means is, “Here’s why you should pay more for an active manager.” And the odds that paying up will lead to better returns are low—no matter what the market environment.
The author or authors do not own shares in any securities mentioned in this article. Find out about Morningstar’s editorial policies.
/cloudfront-us-east-1.images.arcpublishing.com/morningstar/CFV2L6HSW5DHTFGCNEH2GCH42U.jpg)
/cloudfront-us-east-1.images.arcpublishing.com/morningstar/PDHJPZBNVRCAFEQ2AHYHABU2AU.png)
/cloudfront-us-east-1.images.arcpublishing.com/morningstar/54RIEB5NTVG73FNGCTH6TGQMWU.png)
:quality(80)/s3.amazonaws.com/arc-authors/morningstar/360a595b-3706-41f3-862d-b9d4d069160e.jpg)