
Putting Recent Market Volatility in Perspective
Stocks have been more jittery than usual, but volatility is to be expected.
/s3.amazonaws.com/arc-authors/morningstar/360a595b-3706-41f3-862d-b9d4d069160e.jpg)

Editor’s Note: A previous version of this article was published on May 26, 2022.
It’s been a bumpy ride for investors lately.
The Morningstar US Market Index is currently down about 6% from its previous high, with growth stocks, technology shares, and momentum names hit particularly hard. Former highflyers such as Tesla TSLA and Nvidia NVDA have dropped about 25% below their 52-week highs. And as a group, the “Magnificent Seven”—a group of mega-sized tech stocks composed of Nvidia, Tesla, Meta Platforms META, Apple AAPL, Amazon.com AMZN, Microsoft MSFT, and Alphabet GOOGL/GOOG—is down about 14% over the past month.
While value-oriented stocks and small-cap issues have been slightly more resilient, the Morningstar US Large Growth Index has lost about 9% for the trailing one-month period through Aug. 9.
Despite these downturns, the recent market jitters aren’t really outside the usual pattern. In this article, I’ll look at current market volatility relative to previous norms and suggest some ways for investors to cope.
How Bad Is the Current Market?
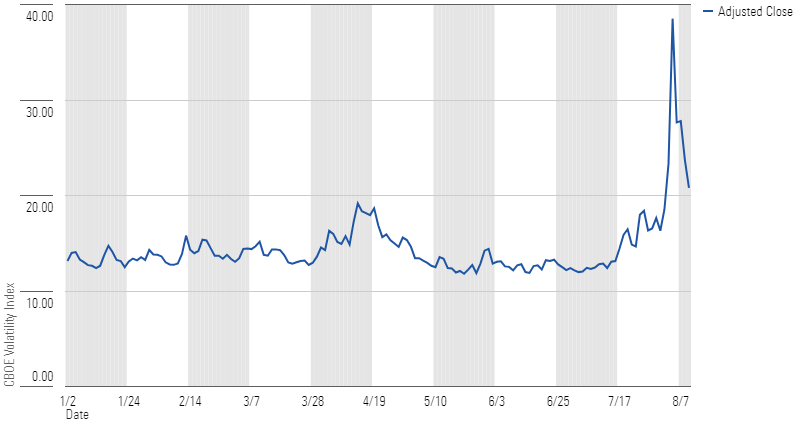
As the chart below shows, market volatility has shown a pronounced spike in recent days. The CBOE VIX Index, which measures market expectations for equity market volatility based on index options for the S&P 500, has jumped up after a relatively quiet trend over the past few months. Markets have been shaken by a few different things, including the rotations out of mega-cap growth stocks, currency turmoil in Japan, and a slightly disappointing jobs report on Aug. 5, which some investors interpreted as a harbinger of recession. As a result, the VIX has recently spiked as high as 38.7 in recent days, compared with an average of about 14 in the first half of the year.
CBOE Volatility (VIX) Index
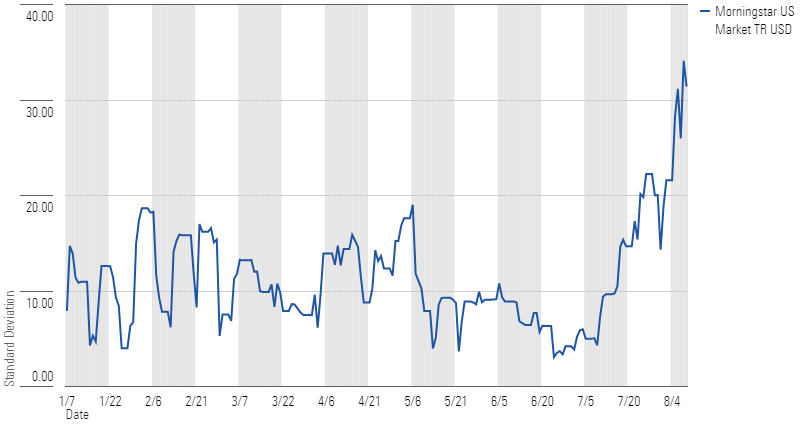
Actual volatility has also increased. After a relatively placid first six months of the year, the rolling seven-day standard deviation for the Morningstar US Market Index has steadily increased in recent weeks. It stood at 31.4% for the trailing seven-day period through Aug. 9, 2024, compared with about 10.5% in the first half of the year.
Market Volatility Trending Up
It’s All Relative
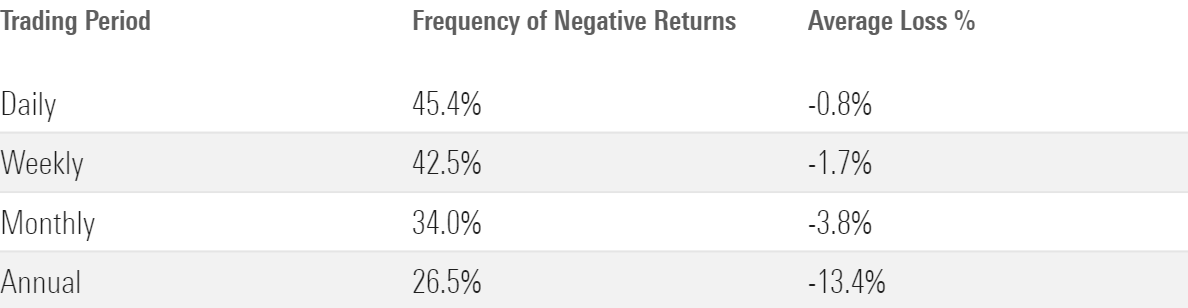
When looked at in the context of longer-term market averages, though, recent market performance hasn’t been that unusual. As the table below illustrates, market losses are actually pretty common. About 45% of trading days finish with negative returns. About 42% of weekly trading periods have historically ended with negative returns, and about a third of all monthly trading periods have finished up in the red. Over longer periods, annual returns have been negative about one fourth of the time.
Losses Are Part of the Territory
Recent market volatility hasn’t been too far outside the usual range, either. In fact, the market’s 3% loss this past Monday doesn’t even rank in the top 100 worst trading days based on daily market returns starting in 1992. So why all the angst about the recent decline?
In my opinion, it’s possible that investors have been lulled into complacency in an environment of low volatility, generally benign headlines, and relatively easy gains on major equity indexes. The fact that losses have been much worse among market darlings that seemed all but guaranteed to mint money might be another factor.
But periodic market downturns are entirely normal and to be expected. Over longer time periods, the market tends to be self-correcting; certain areas may get frothy and reach bubble status, and overall market valuations may overshoot the mark, but periodic downturns are a way of correcting for the excess.
Why the Road Ahead Might Remain Bumpy
Although the economic news now looks more positive than it did a week ago, market turmoil could rear its head again if there’s any sign of an economic slowdown or evidence that inflation is failing to moderate.
Investors might also encounter bumps in the road caused by geopolitical conflicts such as Iran’s attacks on Israel and the ongoing war between Russia and Ukraine, as well as the normal uptick in volatility that usually happens during US presidential election years.
What It Means for Your Portfolio
But while market turmoil can be unpleasant, it ultimately doesn’t matter too much for most long-term investors. (Sequence of returns risk is the exception, because an adverse sequence of returns puts retirees at risk of depleting their portfolios early in retirement and then missing out on an eventual rebound.) Far greater is the risk of permanent capital loss, or the risk of not meeting your long-term financial goals.
As we’ve covered in previous articles, investors unsettled by market turbulence should take a step back to review their investment plans to see if they still make sense. If you’re approaching retirement, for example, you might need to derisk your portfolio to mitigate the danger of starting withdrawals when the market is down. If you’ll need to tap into your portfolio in the next few years (to pay for a down payment or college tuition, for example) or if you’re tempted to sell if things get worse, those can also be legitimate reasons to reconsider your portfolio’s risk level.
But if your portfolio’s asset mix is still a good fit for your time horizon and ability to take on risk, it’s best to tune out the noise and avoid making any major changes: Keep calm and carry on.
The author or authors own shares in one or more securities mentioned in this article. Find out about Morningstar’s editorial policies.
/cloudfront-us-east-1.images.arcpublishing.com/morningstar/VUWQI723Q5E43P5QRTRHGLJ7TI.png)
/cloudfront-us-east-1.images.arcpublishing.com/morningstar/UUSODIGU4REULCOR35PTDS7HW4.jpg)
/cloudfront-us-east-1.images.arcpublishing.com/morningstar/HBAEAVIJHFEBTPMEK2UMVQ3NFQ.png)
:quality(80)/s3.amazonaws.com/arc-authors/morningstar/360a595b-3706-41f3-862d-b9d4d069160e.jpg)