
Market Behavior in 5 Charts: Is 2017 a Return to 2015?
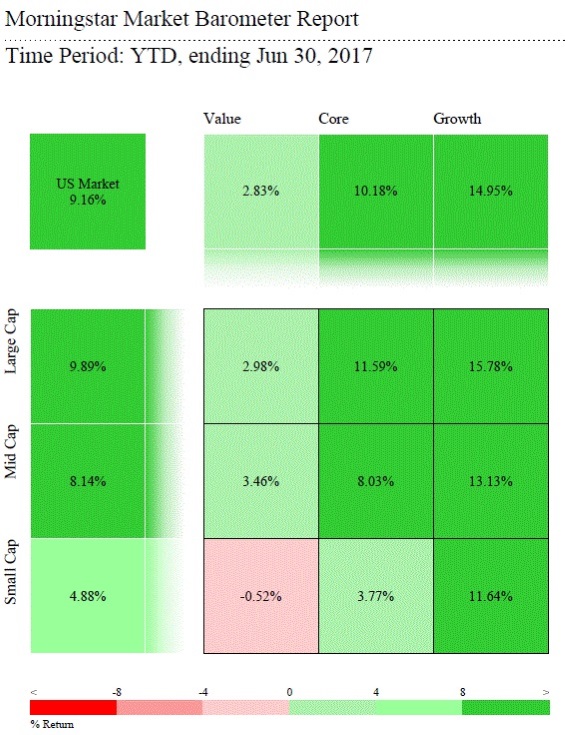
U.S. equity markets in the first half of 2017 have seen something of a return to 2015 market conditions with growth and larger stocks outpacing value and small ones.
/s3.amazonaws.com/arc-authors/morningstar/033528a9-55cc-40aa-90a9-8d2d98697cf5.jpg)
The election set off a rally in the lower left of the Morningstar Style Box, where the stocks of more domestically oriented, cyclical companies soared on the promises of economic growth, infrastructure spending, deregulation, tax cuts, and protectionism.
In 2017, expectations have reset. Market preference has shifted away from the US Steels of the world and back to secular growth stories.
The FANG acronym of 2015 (
So, while the stock market is up nicely in 2017, the “Trump Bump” has faded.
Viewing the U.S. market through the lens of quality, defined by Morningstar’s Economic Moat Rating, a similar story emerges. The Wide Moat Index, comprised of stocks with sustainable competitive advantages, outperformed the No Moat Index by a large margin in the first half of 2017. This was also the case in 2015, as well as more troubled years like 2011 and 2008. In optimistic times, like 2016, 2013, and 2009, a rising tide lifted low quality boats highest. Amazon, Facebook, and Alphabet are all constituents of the Wide Moat Index. By contrast, the No Moat Index contains the aforementioned
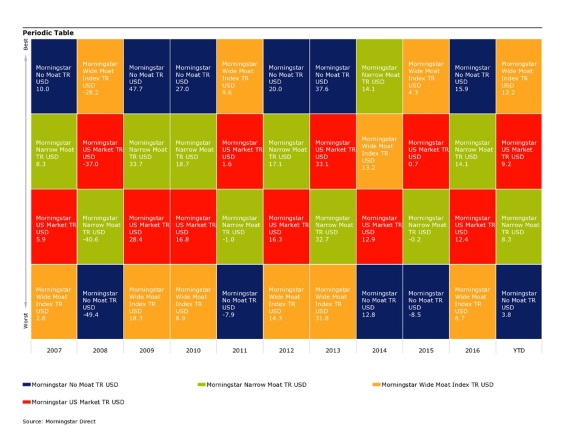
(Click here for full chart)
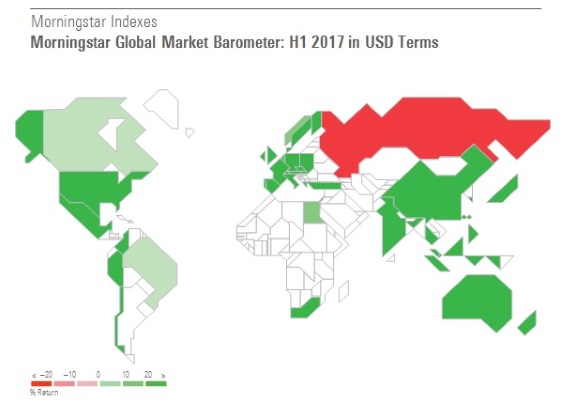
From a global perspective, equity markets have showcased across-the-board strength in 2017, with the notable exception of energy-based Russia. These gains have only been magnified when translated into US dollar terms. The greenback’s slide in 2017 has meant healthy appreciation for US investors holding unhedged exposure to foreign stocks. Dollar weakness represents another reversal from the period of post-election euphoria. Optimism in Europe, Japan, and in most emerging markets, have driven 2017’s gains. This is a real departure from 2015, which was a developed markets-led year.
Then to the bond market, where doomsayers have been scaring investors for years about imminent hikes in rates and rising yields. After the election, inflation expectations pushed the 10-year Treasury higher. This meant losses for Morningstar’s bond indexes in the fourth quarter of 2016. In another 2017 reversal, yields have fallen. Despite the Fed hiking rates in March and June, the bond market has rallied this year. Waning inflation expectations (Trump Slump?) have sent yields down and the Morningstar US Core Bond index up. Meanwhile, corporates are healthy and optimism around global growth has buoyed emerging markets bonds.
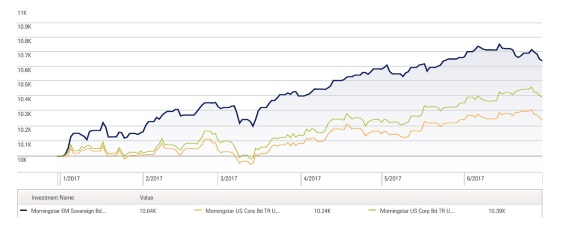
(Click here for full chart)
And finally to commodities, the worst performing asset class of 2017. Falling oil prices drove down Morningstar’s Long-Only Commodities Index. The best you could say for commodities in 2017 is that they looked uncorrelated to stocks and bonds.
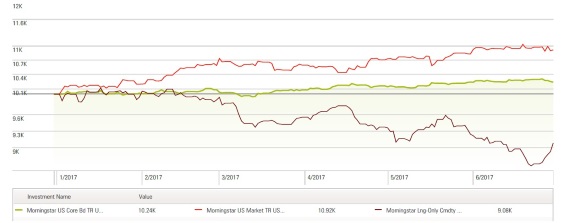
(Click here for full chart)
/cloudfront-us-east-1.images.arcpublishing.com/morningstar/ZYJVMA34ANHZZDT5KOPPUVFLPE.png)
/cloudfront-us-east-1.images.arcpublishing.com/morningstar/YI7RBXKMXVAZDBWEJYQREEJJL4.png)
/cloudfront-us-east-1.images.arcpublishing.com/morningstar/XRD4IQ2J6JG6HCMEDAJSI4ONUY.png)
:quality(80)/s3.amazonaws.com/arc-authors/morningstar/033528a9-55cc-40aa-90a9-8d2d98697cf5.jpg)