
9 Top-Performing Mid-Cap Value Funds
Funds from Vanguard, Fidelity, and Pzena lead the pack.
/s3.amazonaws.com/arc-authors/morningstar/4513c31c-df10-4538-9285-4707e579cd32.jpg)

While mid-cap value funds have lagged the bounce-back that stocks have had so far in 2023, the top performers have put up returns that are often well ahead of the broader market.
The funds providing investors with the best performance over the last one-, three-, and five-year time frames include strategies from Vanguard, Fidelity Investments, and Pzena. Index funds make up the majority of the top of this category.
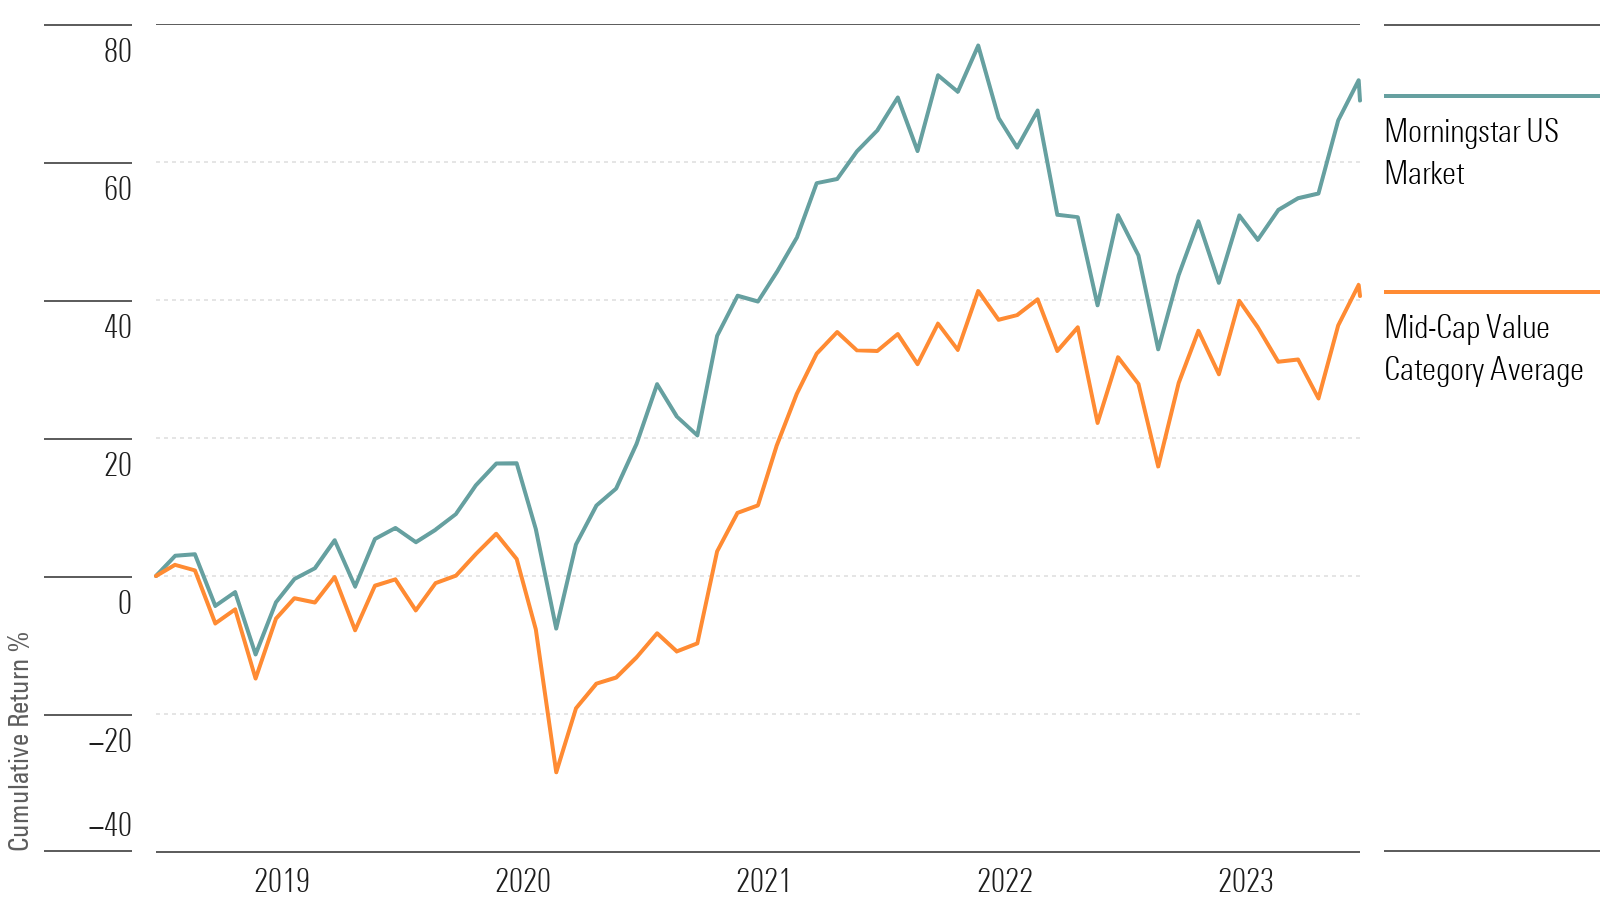
During the 2022 bear market, mid-cap value stock funds delivered for investors, losing only 8.5% while the overall stock market lost 19.4%, as measured by the US Morningstar Market Index.
This year, however, the overall market has gained 20.4%, while the average mid-cap value fund has returned 9.7%. The gap is smaller for the 12-month trailing period ending Aug. 1, during which time the category gained 7.9% compared to the overall market’s 12.8%.
Mid-Cap Value Funds vs. the U.S. Stock Market
What Are the Top Mid-Cap Value Funds?
Stocks in the middle 20% of the capitalization of the U.S. equity market are defined as mid-cap. Value is defined based on low valuations (low price ratios and high dividend yields) and slow growth (low growth rates for earnings, sales, book value, and cash flow). Some mid-cap value portfolios focus on medium-sized companies, while others own a mix of small-, mid-, and large-cap stocks. All look for U.S. stocks that are less expensive or growing more slowly than the market.
9 Top-Performing Mid-Cap Value Funds
To screen for the best-performing funds in this Morningstar Category, we looked for those that have posted top returns across multiple time periods.
We first screened for funds that ranked in the top 33% of the category using their lowest-cost share classes over the past one-, three-, and five-year time frames. In addition, we screened for funds with Morningstar Medalist Ratings of Gold, Silver, or Bronze for those classes. We also excluded funds with less than $100 million in assets and those with no or minimal analyst input about their Medalist Ratings.
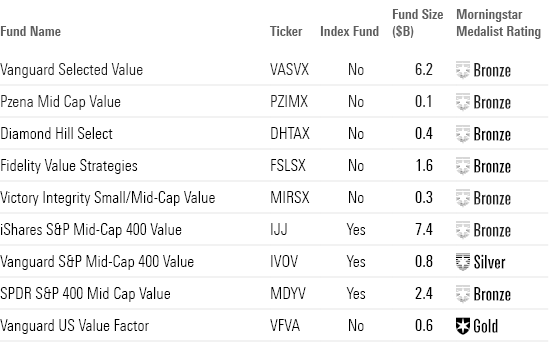
From this group, we’ve highlighted the nine funds with the best year-to-date performance. This group consists of six active funds and three index funds.
Because the screen was created with the lowest-cost share class for each fund, some funds may be listed with share classes not accessible to individual investors outside of retirement plans. The individual investor versions of those funds may carry higher fees, which reduces returns to shareholders.
Top-Performing Mid-Cap Value Funds
Vanguard Selected Value
- Ticker: VASVX
- Morningstar Medalist Rating: Bronze
- Morningstar Rating: 3 stars
“The bulk of this fund’s assets are allocated to deep-value managers. Roughly 60% is with subadvisors Pzena and Donald Smith. They both screen the mid-cap universe for the lowest-priced stocks, but the similarity ends there. Pzena screens for the lowest quintile in terms of price/normalized earnings and looks for beaten-up companies across sectors that have the balance sheet flexibility to solve temporary business issues. Donald Smith sifts for the bottom decile in terms of price/book and looks to make highly concentrated bets in companies with skilled management teams.
“The third subadvisor, Cooke & Bieler, adds yet another flavor of value investing. It manages the remaining roughly 40% and utilizes a more flexible approach that ignores the index when hunting for stocks.
“Donald Smith makes concentrated bets on niche industries, which can produce unique positionings in the aggregate portfolio. But that niche positioning paid off in the market selloff from the start of 2022 through October 2022. This fund lost nearly 10%, but that was less than the index’s nearly 13% drop, as this portfolio’s sizable financials overweighting paid off.”
—Morningstar Manager Research
Pzena Mid Cap Value
- Ticker: PZIMX
- Morningstar Medalist Rating: Bronze
- Morningstar Rating: 3 Stars
“Over the past five years, Pzena’s class shares have returned an average of 8.82% per year, landing it in the 21st percentile of the category. For the last three years, the fund has returned an average of 25.24% a year, leading the fund to the 3rd percentile among all mid-cap value funds. And for the past 12 months, the fund lands in the 6th percentile with a 15.36% gain.
“This strategy targets deeper value plays than its average category peer. But in terms of market capitalization, it is on par with peers. Looking at additional factor exposure, this strategy has consistently favored low-quality stocks compared with peers over the past few years. This strategy has also exhibited a tilt toward high-volatility stocks over these years, meaning it has invested in companies that have a higher historical standard deviation of returns. Such exposure tends to pay off when markets are hot and be costly when they are not.”
—Morningstar Manager Research
Diamond Hill Select Fund
- Ticker: DHTAX
- Morningstar Medalist Rating: Bronze
- Morningstar Rating: 4 Stars
“This strategy has consistently had less exposure to yield compared with its category peers in recent years. This is demonstrated by the portfolio’s low exposure to dividends or buybacks. While companies with high yields provide steady income payments, they may cut payouts if their earnings decline. In the latest month, the strategy was also less exposed to the yield factor than with its category peers.
“This share class mirrored the category average’s 9.4% return over the eight-year period and its 11.0% return over a 10-year period. However, it was able to clear the hurdle of outperforming the category index, the Russell Midcap Value Index, where it led by an annualized 2 percentage points over the same 10-year period.”
—Morningstar Manager Research
Fidelity Value Strategies
- Ticker: FSLSX
- Morningstar Medalist Rating: Bronze
- Morningstar Rating: 4 Stars
“Manager Matt Friedman starts with cheap stocks (usually defined as ones with normalized free cash flow yields at least twice those of the Russell Midcap Value Index) and then seeks a differentiated view on how long their free cash flow streams will last, or how long they might take to improve to normal levels. Beyond that, he looks for strong competitive positions, high return metrics, capable management, and robust balance sheets. Friedman often looks to deleveraging as a source of value, and he’s comfortable with high debt levels if he thinks there’s enough cash flow to support it.
“The strategy has among the highest aggregate debt levels in the category, so it often excels in rallies and struggles mightily in drawdowns, as it did in 2018′s fourth quarter and 2020′s first quarter. However, it held up relatively well in the decline in the first 11 months of 2022, thanks to savvy energy picks and more robust risk management. The strategy’s record since Friedman rejoined in 2016 is excellent, with annualized total returns through November 2022 beating the Russell Midcap Value Index by roughly 2 percentage points and landing in the category’s top decile.
“At the right price, this a reasonable offering for investors who can stomach potentially bumpy results.”
—Eric Schultz, analyst
Victory Integrity Small/Mid-Cap Value
- Ticker: MIRSX
- Morningstar Medalist Rating: Bronze
- Morningstar Rating: 4 Stars
“Over the past five years, these shares have returned an average of 8.64% per year, landing the fund in the 24th percentile of its category. For the last three years, the fund has returned an average of 22.79% a year, putting it in the 9th percentile. And for the past 12 months, the fund has been in the 22nd percentile with an 11.23% gain.
“An analysis of the strategy’s portfolio shows it has maintained a considerable overweight position in liquidity exposure and has an overweight in volatility exposure compared with category peers. High liquidity exposure is attributed to stocks with a high trading volume, lending managers more flexibility. High volatility exposure is rooted in stocks that have a higher standard deviation of returns. The strategy’s parent organization is industry standard, albeit with some strong attributes like a commendable risk-adjusted track record, but it is held back by high fees.”
—Morningstar Manager Research
iShares S&P Mid-Cap 400 Value
- Ticker: IJJ
- Morningstar Medalist Rating: Bronze
- Morningstar Rating: 3 Stars
“The fund tracks the S&P MidCap 400 Value Index, which encompasses stocks from the cheaper half of the S&P MidCap 400 Index. Value stocks are usually characterized by low price-to-book and low price-to-earnings ratios.
“While some peers venture further to the deep value end of the style box, this fund’s approach leads it to include some blend and even growth names in the portfolio. The resulting allocation is more moderate than those of some peers, but it still effectively captures the value factor.
“Sector differences relative to the category average helped the fund outperform its average peer in 2022. The fund maintained a slightly lesser position in communication stocks, which partially insulated it from that sector’s steep fall during the year. Volatility overall was stubbornly higher, though, which caused risk-adjusted returns to lag the average peer.”
—Zachary Evens, associate analyst
Vanguard S&P Mid-Cap 400 Value Index
- Ticker: IVOV
- Morningstar Medalist Rating: Silver
- Morningstar Rating: 3 Stars
“Over the past five years, this fund’s shares have returned an average of 8.39% per year, putting it in the 29th percentile of its category. For the last three years, it’s returned an average of 19.98% a year, landing it in the 19th percentile. And for the past 12 months, the fund has been in the 30th percentile with a 10.61% gain.
“Most key value metrics are closely tied to the category average. Approximating the category average should help this fund turn its low fee into a distinct performance advantage.”
—Zachary Evens
SPDR S&P 400 Mid Cap Value
- Ticker: MDYV
- Morningstar Medalist Rating: Bronze
- Morningstar Rating: 3 Star
“This share class led its average peer by an annualized excess return of 1.3 percentage points over a 10-year period. It was also ahead of the Russell Midcap Value Index by 79 basis points over the same period.
“The portfolio’s sector composition looks a little different than that of its average peer due to its size and style orientation. For example, its energy allocation dwindled to less than 1% of the portfolio as names like EQT EQT and HF Sinclair DINO grew too large for the fund’s size mandate. The category’s average allocation to that sector is 6%. This fund compensates for the deficit with greater allocations to consumer cyclical, real estate, and technology stocks.”
—Zachary Evens
Vanguard U.S. Value Factor ETF
- Ticker: VFVA
- Morningstar Medalist Rating: Gold
- Morningstar Rating: 3 Stars
“This strategy leans toward smaller, more value-oriented companies than its average category peer does. Analyzing additional factors, this strategy has consistently overweighted the volatility factor compared with peers over the last few years, meaning it invests in stocks with histories of higher standard deviations of returns. This contributes to a higher-risk, higher-reward approach.
“A new management team took the reins in July 2022, and so far they have posted middling results. The strategy has earned a 2.9% return over these past 11 months, underperforming its typical peers’ 3.8% but exceeding the Russell Midcap Value Index’s 1.7% return. With such a narrow time frame, it is difficult to meaningfully assess the fund’s risk.”
—Morningstar Manager Research
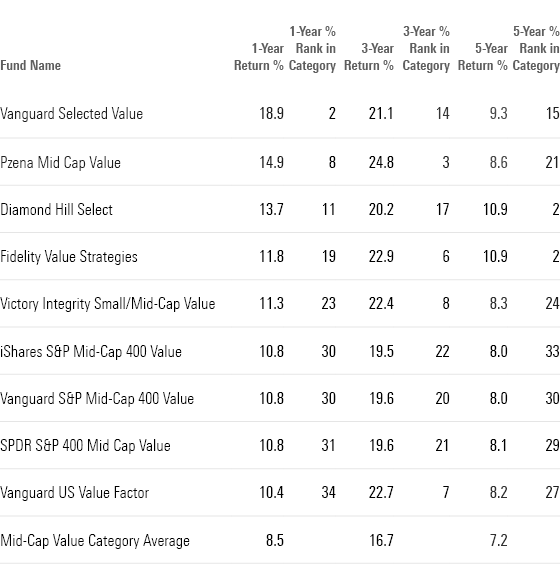
Long-Term Returns of Top-Performing Mid-Cap Value Funds
The author or authors do not own shares in any securities mentioned in this article. Find out about Morningstar’s editorial policies.
/cloudfront-us-east-1.images.arcpublishing.com/morningstar/KVRQ726W7RFHLPM2IY7EGD7SQU.png)
/cloudfront-us-east-1.images.arcpublishing.com/morningstar/VUWQI723Q5E43P5QRTRHGLJ7TI.png)
/cloudfront-us-east-1.images.arcpublishing.com/morningstar/UUSODIGU4REULCOR35PTDS7HW4.jpg)
:quality(80)/s3.amazonaws.com/arc-authors/morningstar/4513c31c-df10-4538-9285-4707e579cd32.jpg)