
A Look Under the Hood of 5 Momentum Funds
Momentum funds that aggressively chase performance and keep implementation costs down have the best chance to succeed.
/s3.amazonaws.com/arc-authors/morningstar/56fe790f-bc99-4dfe-ac84-e187d7f817af.jpg)
A version of this article was published in the March 2017 issue of ETFInvestor. Download a complimentary copy of ETFInvestor by visiting the website.
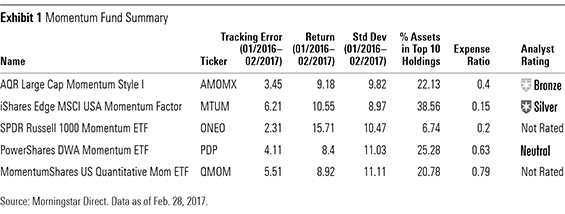
Momentum investing is based on the observation that recent performance tends to persist in the short term [1]. On paper, it has been one of the highest-returning factor strategies documented. But it is also the hardest to capture in practice. There are only a handful of rules-based funds that explicitly target stocks with high momentum, but they can look and perform differently from one another, as Exhibit 1 illustrates. So, a closer look is necessary to uncover the best option.
In the academic literature, momentum is commonly measured based on performance over the past 12 months (excluding the most recent one, as performance tends to revert over that horizon), updated each month. Applying this simple approach to stocks larger than the median name on the New York Stock Exchange, a market-cap-weighted portfolio of the highest ranking 30% would have outpaced the lowest ranking 30% by 6 percentage points annualized over the trailing 50 years through January 2017. But this would be a tough strategy to put into practice, because it requires very high turnover that can create high transaction costs. Most momentum funds take steps to reduce transaction costs, which can cause their portfolios to deviate from this simple academic construction and reduce their style purity.
There is also a trade-off between active risk and potential returns. Funds that pursue momentum more aggressively have a greater risk of significantly underperforming the market when momentum is out of favor, though they should also have higher returns over the long term. Exhibit 1 highlights five funds that focus on large- and mid-cap U.S. stocks with high momentum. Each fund listed differs in its approach to measuring momentum and in how aggressively it pursues the style. Of these,
AQR's Approach to Portfolio Construction AQR assigns composite momentum scores to the 1,000 largest U.S. stocks based on their performance over the past 12 months (excluding the most recent one), earnings momentum, and residual momentum. Earnings momentum measures performance around earnings announcements over the past 12 months, while residual momentum measures returns over that period after controlling for market sensitivity, size, and value characteristics. This residual measurement removes the returns attributable to style characteristics to get a cleaner read on the return unique to each stock. These additional metrics provide a more holistic view of each stock's momentum. That said, the standard price momentum metric is the most important component in the fund's selection process. The fund targets the stocks in the highest ranking third of the selection universe and weights its holdings according to both their market capitalization and the strength of their momentum.
The managers update their model every month and rebalance the portfolio in a manner that smooths out changes from month to month. This smoothing approach causes the fund to own more than one third of the names in its selection universe, slightly diluting its momentum exposure, but it also reduces transaction costs. The managers take transaction costs into account and won’t trade unless the expected benefit of doing so exceeds the estimated cost. But this fund is less tax-efficient than its exchange-traded fund peers, which can use in-kind redemptions to purge low cost-basis shares from their portfolios.
Momentum ETFs
The least expensive of the four ETFs listed in Exhibit 1,
Yet, this risk-adjustment should help the fund avoid loading up on the riskiest names during bull markets, which tend to underperform during market reversals. It should also increase the fund’s exposure to stocks with momentum that is more likely to persist. This is because stocks with steady price improvement are more likely to enjoy gradual improvements in fundamentals that investors may underappreciate than those with greater volatility. Such underreaction can lead to persistent price movements. Investors are more likely to underreact to a string of small changes than they are to larger and more discrete ones, such as news about FDA approval for a new drug. So, the quality of momentum (consistency of price movements) matters.
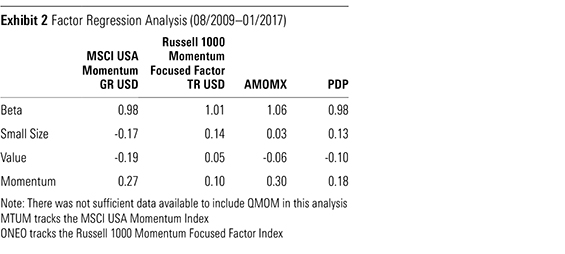
This strategy was designed with capacity in mind. It only rebalances twice a year and it applies buffers around its selection cut-off to mitigate unnecessary turnover. Both of these adjustments reduce the fund’s style purity. But because it applies more stringent selection criteria than AQR, covering a narrower swath of the market, it still has comparable exposure to the classic momentum factor documented in the academic literature, as shown in Exhibit 2. This table reports the results of a regression analysis that explains each fund’s returns (or the returns of the index it tracks) as a function of four variables: exposure to the market risk (beta), size, value, and momentum factors.
As illustrated in Exhibit 1, MTUM is the most concentrated portfolio of the bunch and it has exhibited the highest tracking error to the Russell 1000 Index. This concentration gives the fund slightly greater exposure to firm-specific risk than its peers, though it appears manageable. Despite this concentration, the fund has exhibited lower volatility than its peers, owing to its risk-adjusted selection criteria. The combination of its cost advantage, strong exposure to the momentum factor, and cost-efficient implementation make this the most attractive momentum ETF, in Morningstar’s view.
PDP applies more demanding selection criteria than ONEO, and it rebalances more often (quarterly) to better capture the momentum effect. Its weaker exposure to the classic momentum factor than AMOMX and MTUM has more to do with the distinctive way it measures momentum. It uses a point and figure charting approach that does not look at a prespecified period. Instead, it detects price trends when a stock's performance relative to the index changes by a prespecified amount (6.5%). For each increase or decrease of 6.5%, the fund’s index plots an X (for up movements) or an O (for down movements). It only looks at the most recent trend column (consecutive X or O plots), which could capture different time periods for different stocks. Each quarter, the fund ranks the 1,000 largest U.S. stocks on their relative strength, targets the highest ranking 100, and weights them in proportion to their relative strength.
This is a less-efficient way to get exposure to momentum than a time series approach. And performance comparisons over different periods are likely less meaningful than they are over a predefined horizon. Given these drawbacks, it’s hard to justify paying up for this strategy.
The fund weights its holdings equally, which adds to its already-high turnover and introduces a permanent bias toward smaller stocks. It updates the portfolio each quarter, one month prior to the quarter-end to take advantage of seasonal effects. There are no buffers in place to mitigate turnover, so it will trade even if doing so doesn’t have a big impact on the fund’s momentum profile and the costs of trading exceed the benefit.
This aggressive approach should give the fund an edge when the momentum style is in favor. But its equal-weighting approach could partially offset the fund’s momentum tilt because it causes the strategy to rebalance out of stocks as they appreciate (if they stay in the portfolio), and it ignores the strength of its holdings’ momentum characteristics. This concentrated, smaller-cap-oriented portfolio will also likely continue to exhibit greater volatility than its peers.
AMOMX versus MTUM While MTUM stands out among its ETF peers, it is more difficult to choose between that offering and AQR. Both funds offer comparable exposure to the classic momentum factor and take steps to avoid transactions where the costs exceed the likely benefits. Yet, AQR has exhibited lower tracking error to the Russell 1000 Index. This means that it tends to take less active risk than MTUM, allowing investors to make a cleaner bet on momentum. This comes at the cost of a higher expense ratio, slightly higher volatility, and lower tax efficiency, which (coupled with AMOMX's lackluster record) are the reasons for MTUM's higher Morningstar Analyst Rating. In a tax-sheltered account, AQR is more compelling, particularly for those who want a lower risk of significantly underperforming the market. But MTUM's lower fee and focus on risk-adjusted performance still make it Morningstar's favorite U.S. large-cap momentum fund.
Reference
[1] For further reading, please see "Does Momentum Investing Work?" by Alex Bryan, published on Morningstar.com on April 10, 2013.

Disclosure: Morningstar, Inc. licenses indexes to financial institutions as the tracking indexes for investable products, such as exchange-traded funds, sponsored by the financial institution. The license fee for such use is paid by the sponsoring financial institution based mainly on the total assets of the investable product. Please click here for a list of investable products that track or have tracked a Morningstar index. Neither Morningstar, Inc. nor its investment management division markets, sells, or makes any representations regarding the advisability of investing in any investable product that tracks a Morningstar index.
/cloudfront-us-east-1.images.arcpublishing.com/morningstar/AGAGH4NDF5FCRKXQANXPYS6TBQ.png)
/cloudfront-us-east-1.images.arcpublishing.com/morningstar/RSZNI74R6FG7FDSWBUF6EWKDE4.png)
/cloudfront-us-east-1.images.arcpublishing.com/morningstar/NPR5K52H6ZFOBAXCTPCEOIQTM4.png)
:quality(80)/s3.amazonaws.com/arc-authors/morningstar/56fe790f-bc99-4dfe-ac84-e187d7f817af.jpg)