
The Incredible Shrinking CEF Universe
The number of closed-end funds available has shrunk by nearly one fifth since 2011.
/s3.amazonaws.com/arc-authors/morningstar/af89071a-fa91-434d-a760-d1277f0432b6.jpg)
Closed-end funds are quickly becoming an endangered species.
The number of CEFs has dwindled during the past five years as fund liquidations and mergers have handily outpaced initial public offerings. The universe of available CEFs has fallen to 565 as of June 1, 2015, from almost 700 in 2011. So far this year, there have been two IPOs (the second just last month) and eight liquidations and mergers through the end of May, with more CEFs soon to be disappearing: The board of directors of Alliance NY Municipal Income Fund AYN has approved a liquidation plan for the fund, pending shareholder approval, and Nuveen Investments plans to convert two CEFs to exchange-traded funds, pending shareholder and regulatory approval. This year is shaping up to be the fourth-straight year that more closed-end funds depart than are brought to market.
On one hand, the industry's shrinkage is surprising given investors' insatiable appetite for income since the financial crisis and the ensuing record-low interest rates. CEFs offer compelling distributions compared with open-end funds, and for a time, many fixed-income CEFs traded at significant premiums because of this advantage. For example, the average muni-national intermediate-term CEF had a distribution rate of 3.68% as of May 31, more than 120 basis points higher than the average open-end muni-national intermediate-term bond fund. Of course, there are other factors like leverage and a propensity to hold riskier fare that affect the distribution rates of CEFs. Nonetheless, the market for CEF IPOs hasn't recovered from the financial crisis and seems unlikely to do so.
Instead, there's been a combination of CEF sponsors consolidating lineups (particularly when it comes to single-state muni CEFs), hand-wringing over the IPO process, and a surge of interest in ETFs, the hip new investment product. The chart below shows the number of CEF launches and closures (due to both liquidations and mergers) for each calendar year from 2011 to May 2015. Meanwhile, the number of ETFs jumped to more than 1,700 as of the end of May from 1,100 in 2011.

Source: Morningstar.
The CEF IPO process is facing tougher scrutiny than ever before as the financial advice industry moves away from commission-based compensation. In 2014, for example, the percentage of U.S. advisory firms that were commission-only fell to 11% from 17% in 2012, according to Cerulli Associates. Commission-driven brokers tend to be big sellers of CEF IPOs.
At the same time, investors have become more demanding of new issues. This year's IPOs have offered unusual shareholder covenants. Calamos Dynamic Convertible and Income CCD and AllianzGI Diversified Income & Convertible ACV both have 15-year limited terms, a shareholder-friendly option that causes the fund to liquidate at its net asset value at the end of the term unless shareholders vote to keep the fund going. Calamos Dynamic Convertible and Income even pledged to keep the fund's share price within a 2% discount from NAV between July 7 (just less than two months after launch) and Feb. 26, 2016. As of June 8, the fund was trading at a slight premium to NAV.
With momentum growing for a fiduciary standard, which would require all advisors (not just Registered Investment Advisors) to always act in their clients' best interests, it's likely that commission-based compensation agreements will be placed under even greater scrutiny. That means paying a premium price for something that is likely to trade at a discount in a short amount of time, as most CEF IPOs do, could be a thing of the past. Unless the industry starts making greater concessions to shareholders along the likes of Calamos and Allianz, we're likely to continue to see the universe shrink.
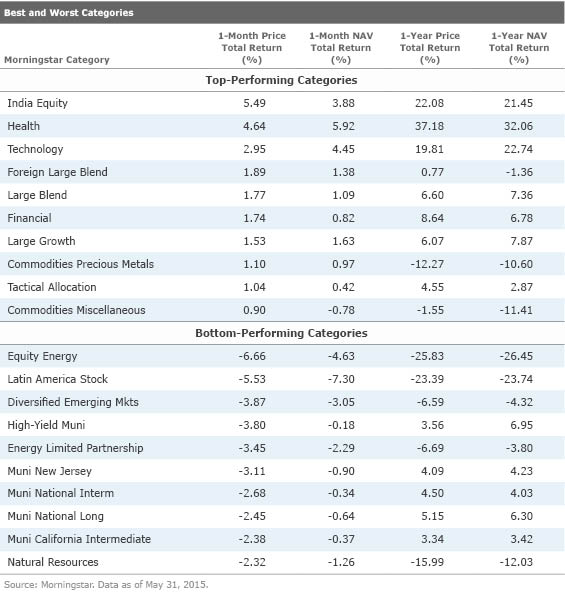
Best- and Worst-Performing CEF Categories Health-care CEFs have been one of the best-performing categories over the trailing 12 months and three years through May, though not without volatility. The group's 4.6% average gain last month landed it near the top of the best-performing category list, while a 2.5% average loss landed the group on the bottom-performing list in April.
Topping the list last month was the India equity Morningstar Category, another well-performing category over one- and three-year periods. An improving economic environment coupled with strong corporate earnings growth and reforms in the banking, real estate, and infrastructure sectors aided returns for Indian equities. The Bombay Stock Exchange's Sensex Index rose nearly 30% in 2015 and is up more than 15% on a 10-year annualized basis through May 2015. Year-to-date returns have been volatile (it's up just 1.9% through May), but during May, the index gained 3.0% while the average India-equity CEF gained 5.5% on share price and 3.9% on NAV.
Long-term Treasury rates continued to climb in May--the 30-year rate reached 2.88% on May 29, up from 2.75% on April 30. The rise in rates caused long-duration municipal-bond CEFs to perform poorly, with four municipal categories landing in the bottom-performing category list for May.
Volatility in energy prices weighed heavily on equity energy, master limited partnerships, and natural-resources CEFs last month, and each category landed on the bottom-performing list. Although Brent crude-oil prices rose in May, the number of rigs dropped and estimated inventories of oil increased. For energy firms (generally those stocks are held by the funds in the equity energy category), lower rig counts mean lower profitability, putting downward pressure on stock prices. The equity energy category lost an average of 6.7% on share price and 4.6% on NAV in May.
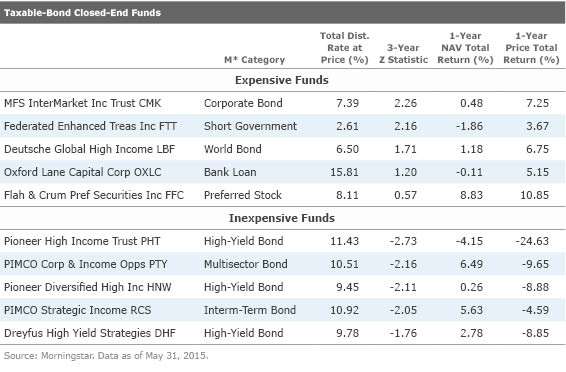
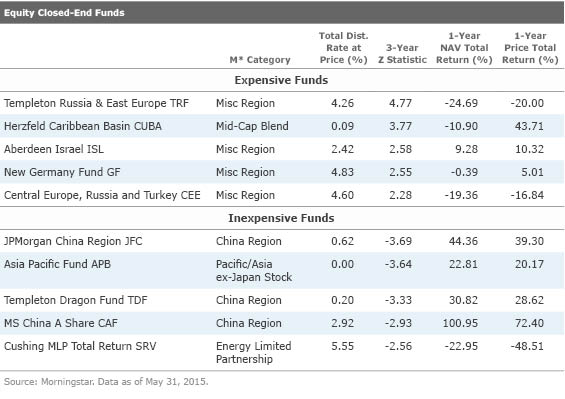
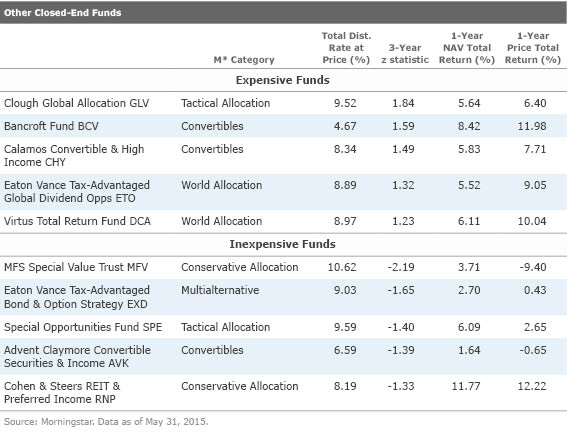
Most Expensive and Inexpensive CEFs The exhibits below list the most expensive and inexpensive CEFs based on three-year z-statistics as of June 8. The z-statistic measures how many standard deviations a fund's discount/premium is from its three-year average discount/premium. For instance, in these tables, a fund with a z-score of negative 2 would be two standard deviations below its three-year average discount/premium. Funds with the lowest z-scores are classified as Relatively Inexpensive, while those with the highest z-scores are Relatively Expensive. We consider funds with a z-score of negative 2 or lower to be "statistically undervalued" and those with a z-score of 2 or higher to be "statistically overvalued."
Taxable-Bond CEFs
A rare sight emerged in May: A pair of PIMCO CEFs began to appear undervalued as shares started to trade closer to their respective NAVs.
Municipal CEFs A few muni CEFs are starting to look undervalued as rising interest rates are pushing some investors toward the exits. Muni CEFs tend to have longer durations than both taxable-bond CEFs and (generally unleveraged) open-end muni funds. The 10-year Treasury yield has been marching higher since early February, when it hit its year-to-date low of 1.68%. At the end of May, the benchmark yield was at 2.12% and by the second week of June it had peaked at 2.50%. The average muni CEF discount widened to 6.3% from 4.6% at the end of the month.

Equity CEFs This year's top-performing funds through May are looking undervalued based on their three-year average discounts. MS China A Share CAF and JPMorgan China Region JFC are the best-performing CEFs year to date through May with NAV returns of 27% and 23%, respectively. Templeton Dragon Fund TDF and Asia Pacific Fund APB aren't far behind, with returns of 20% and 18%. All the funds have been driven by the strong rally in Chinese stocks, but it appears some investors are stepping back as all four funds have seen discounts widen recently.
News You Can Use Initial Public Offerings As previously mentioned, AllianzGI launched the second CEF of 2015. AllianzGI Diversified Income & Convertible launched on May 29 and raised $280 million in assets. The fund's size could grow to $322 million if underwriters exercise all of their overallotments. This is not only the second CEF to launch this year, but also the second convertibles strategy to launch this year. A well-experienced team that runs various convertibles strategies for Allianz will also run this fund.
Shareholder Activism
Adams Diversified Equity ADX was under pressure from an activist shareholder to consider a number of actions to narrow the fund's persistent discount. At a May 5 meeting, shareholders voted on a proposal for a self-tender offer, among other issues. The activist investor recommended the fund participate in a self-tender offer for all of its outstanding shares, with the fund's persistent discount being the main reason behind the proposal. Of the votes cast on this proposal, 74% voted against it and 23% (representing only 13% of the fund's outstanding shares) voted for it. At the same meeting, shareholders also voted to re-elect each of the fund's directors, approved an amendment to the fund's fundamental investment policy on investments in commodities or commodities contracts, approved a provision that allows the fund to provide investment advisory services to outside accounts, and ratified the selection of PricewaterhouseCoopers LLP as the fund's independent registered public accounting firm for 2015.
Fund Liquidations and Mergers Alliance NY Municipal Income Fund announced that its board of directors has approved the plan of liquidation, subject to shareholder approval. The liquidation is expected to be submitted to shareholders at a meeting to be held on Aug. 3.
Shareholders of Nuveen New York Performance Plus Municipal and Nuveen New York Dividend Advantage Municipal 2 approved a merger of both funds into Nuveen New York Dividend Advantage Municipal NAN. The merger was completed on June 8.
Nuveen Long/Short Commodity CTF announced that its shareholders have approved the plan to convert the fund into an ETF, although the conversion is still dependent on regulatory approval.
Other News AllianceBernstein offered to purchase the outstanding auction-rate preferred shares of AllianceBernstein California Municipal Income AKP and AllianceBernstein National Muni Income AFB for 90% of liquidation value. PIMCO used this tactic for two of its CEFs in October 2014 (PIMCO Income Strategy PFL and PIMCO Income Strategy II PFN) and one earlier this year (PIMCO Corporate & Income Opportunity). The firm offered to purchase the ARPS for similar percentage of par and shareholders weren't too keen to surrender their ARPS for less than par value: Just 35% of PIMCO Income Strategy, 43% of PIMCO Income Strategy II, and 27% of PIMCO Corporate & Income Opportunity ARPS were tendered. Investors can expect similarly low tender percentages from AllianceBernstein's attempt.
Clough Global Allocation GLV, Clough Global Equity GLQ, and Clough Global Opportunities GLO announced a participation agreement with RiverNorth Capital Management, a Chicago-based asset manager that specializes in opportunistic investment strategies, including an open-end fund that invests tactically in CEFs. Under the agreement, RiverNorth may purchase shares of the three funds in excess of investment limitations, provided that certain requirements are met. The agreement is meant to improve shareholder liquidity.
Delaware Investments Dividend and Income DDF announced that it will purchase up to 5% of its outstanding common shares for a price equal to 98% of the net asset value per share as of the close of trading on the first business day after the offer expires. The offer commenced on June 1 and will expire on June 26. The fund has a six-month average discount of just over 10% as of June 8.
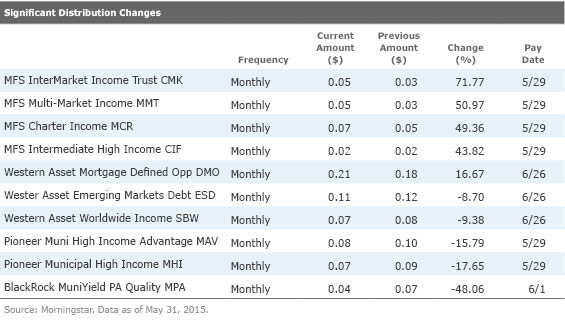
The table below lists significant distribution changes during May.
Discounts and Premiums During May, the average discounts widened for all four broad category groups, though municipal funds saw the largest gap, to 6.3% from 4.6% during the month. Municipal funds, in general, tend to have long durations, and CEF municipal funds have even longer durations, often reaching double digits because of the use of leverage. As the long end of the yield curve has increased during the last few months, these funds have taken a hit on both share price and NAV, but investors are demanding more compensation for taking on the rate risk, and many funds' share prices have dropped much more significantly than the underlying NAVs during the last few months.

Source: Morningstar.
/cloudfront-us-east-1.images.arcpublishing.com/morningstar/OMVK3XQEVFDRHGPHSQPIBDENQE.jpg)
/cloudfront-us-east-1.images.arcpublishing.com/morningstar/AGAGH4NDF5FCRKXQANXPYS6TBQ.png)
:quality(80)/s3.amazonaws.com/arc-authors/morningstar/af89071a-fa91-434d-a760-d1277f0432b6.jpg)