
Active Funds Continue to Fall Short of Their Passive Peers
Investors should focus on long-term signals and costs when picking their spots, based on the latest Active/Passive Barometer.
/s3.amazonaws.com/arc-authors/morningstar/0fa19b38-60f6-4a0f-9e06-9869d9c57d52.jpg)

Brutal market performance in 2022 reignited the narrative that active funds can better navigate market turmoil than passive peers. Despite an uptick in success rates by U.S. stock-pickers, the latest evidence debunks these claims yet again. As Warren Buffett once said, “only when the tide goes out do you discover who’s been swimming naked.” In 2022, it turned out that active bond and real estate funds were caught skinny-dipping.
Of the nearly 3,000 active funds included in our analysis, only 43% survived and outperformed their average passive peer in 2022. We further analyze these findings in the year-end 2022 installment of the Morningstar Active/Passive Barometer, a semiannual report that measures the performance of U.S. active funds against passive peers in their respective Morningstar Categories. The Active/Passive Barometer spans nearly 8,400 unique funds that accounted for approximately $15.7 trillion in assets, or about 65% of the U.S. fund market, at the end of 2022. The full report can be found here.
You can learn more about the background on our approach to the report in this article.
Most Active Managers Have Failed to Capitalize on Volatility
When viewed as a whole, active funds had less than a coin flip’s chance of surviving and outperforming their average passive peer in 2022, although results varied widely across asset classes and categories. For example, U.S. stock-pickers handled volatility much better than foreign-stock funds. The former cohort outgained its average passive peer 49% of the time in 2022, while only 34% of the latter group succeeded.
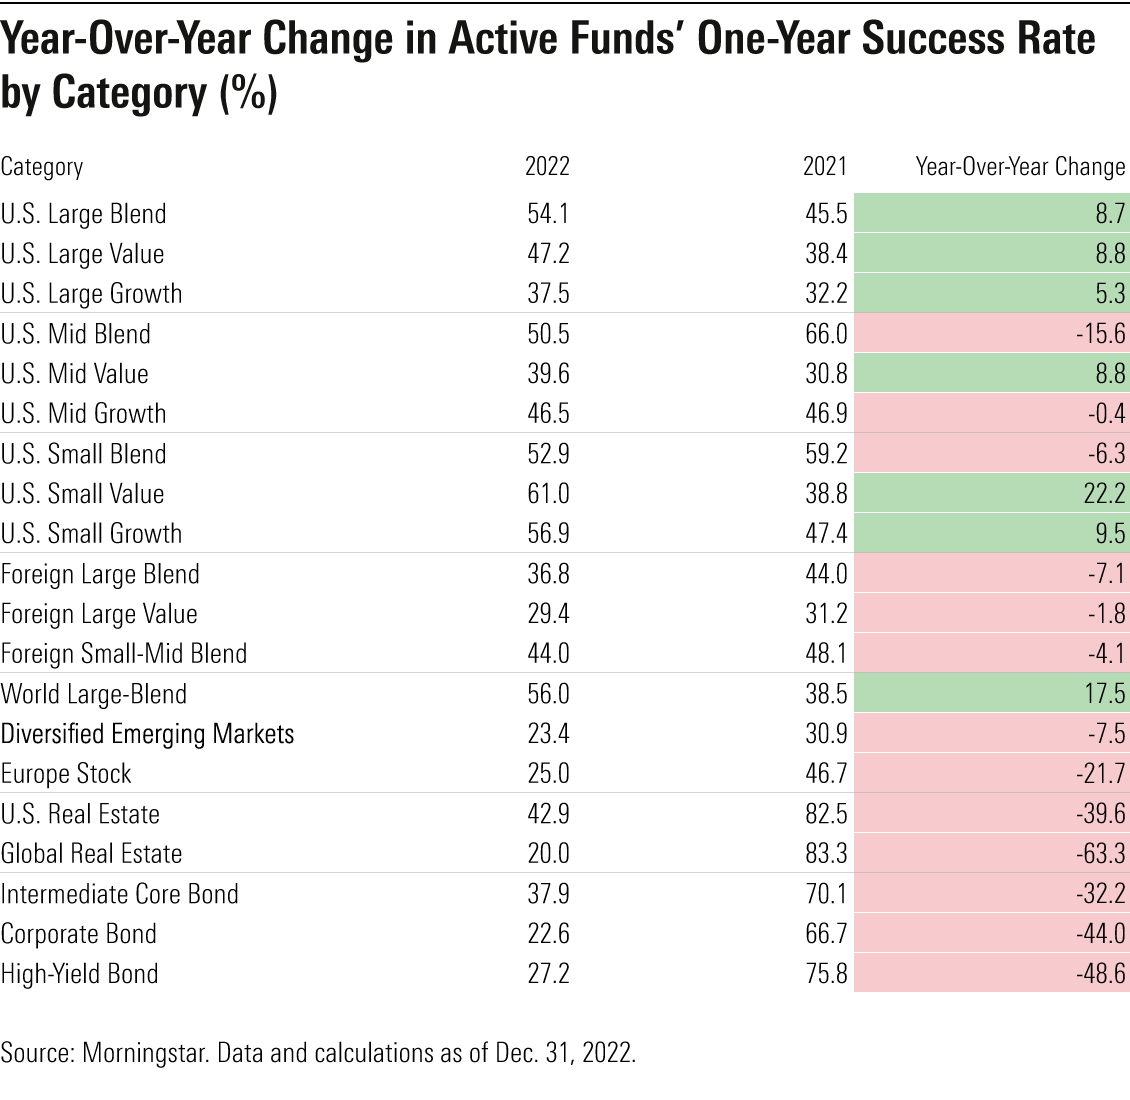
Overall, active bond funds had a rough year, with just 30% besting their average index peer last year. The one-year success rate for active managers across the three fixed-income categories dropped 42 percentage points from their mark in 2021. Active managers had a tougher time in corporate bonds (23% success rate) than intermediate core bonds (38%). Exhibit 1 details the year-over-year change in success rate by category from 2021 and 2022.
But one year isn’t a sufficient time horizon from which to draw conclusions. Success rates can fluctuate wildly from year to year, depending on what’s going on in the markets and how that reflects on the actively managed portfolios as well as in the passive funds that we measure them against. For example, many active bond funds tend to take more credit risk than their index peers. Their success rates tend to rise when this risk is rewarded and fall when credit spreads widen, as they did last year.
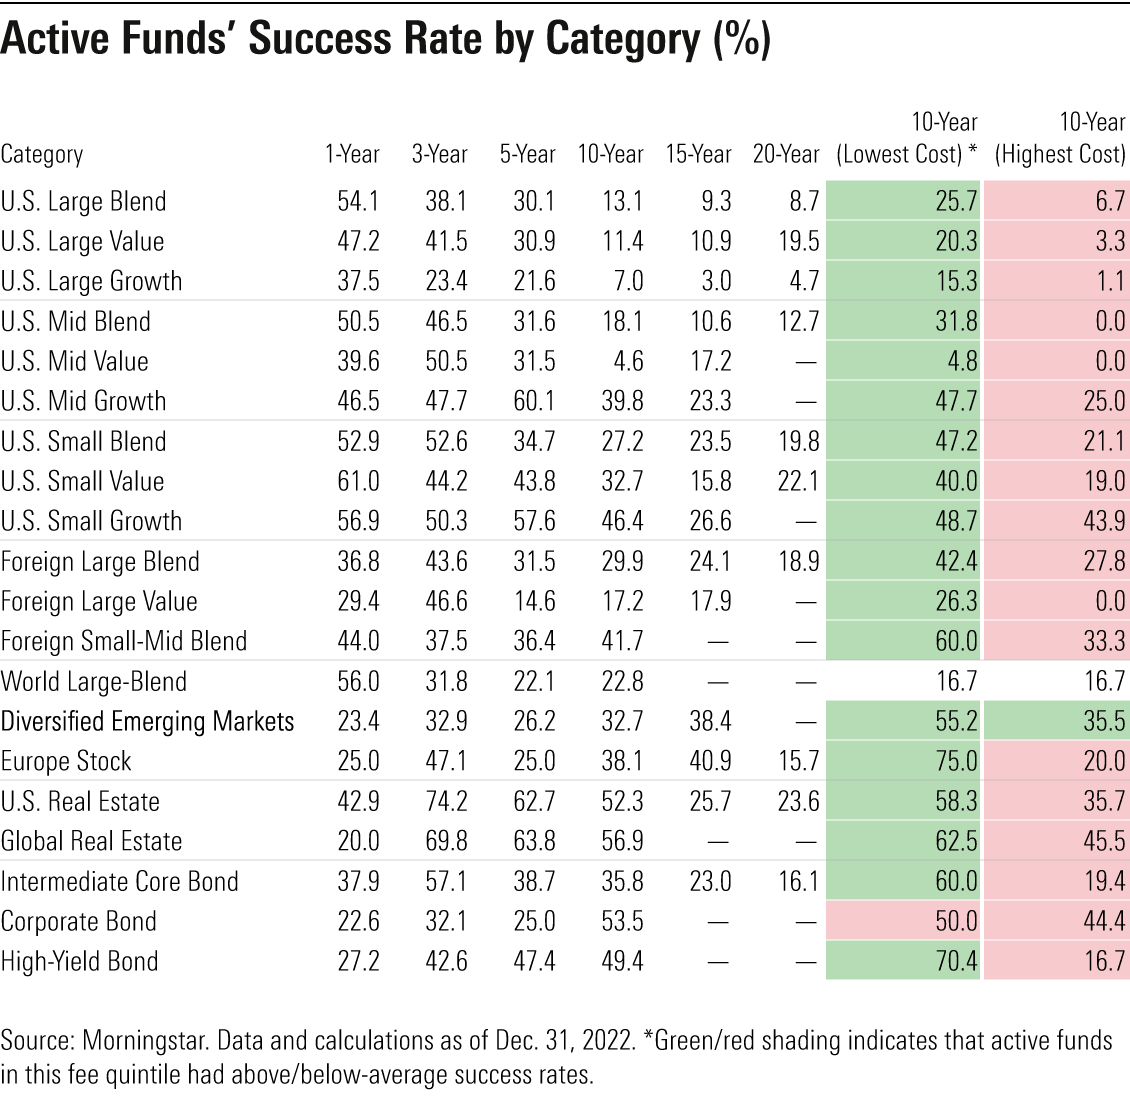
Longer horizons provide stronger signals that investors can incorporate into their selection processes. In general, actively managed funds have failed to survive and beat their benchmarks, especially over longer time horizons. Only one out of every four active funds topped the average of their passive rivals over the 10-year period ended December 2022.
But success rates vary across categories. Long-term success rates were generally higher among bond, real estate, and foreign-stock funds, where active management may hold the upper hand. Investors can use this data to identify areas of the market where they have better odds of picking winning active funds.
Sizing Relative Performance of Passive and Active Investing
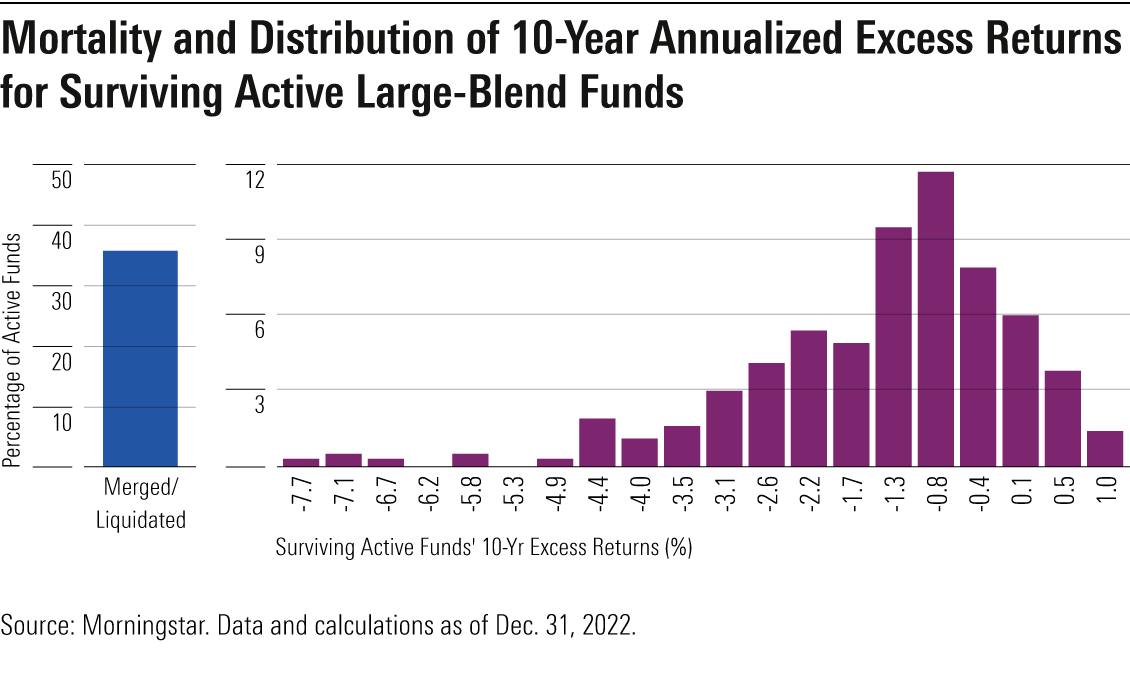
Success rates alone only tell half the story. The other half is the prospective payoff for choosing a winning fund and the penalty for picking a loser. The Active/Passive Barometer provides this information by plotting of the distribution of 10-year excess returns for surviving active funds versus the average of their passive peers.
Much like success rates, these distributions vary widely across categories. In the case of U.S. large-cap funds, the distributions skew negative. This paints a bleak picture for active funds in these categories. They have low long-term success rates, while penalties are high for picking a loser (per the negatively skewed distribution).
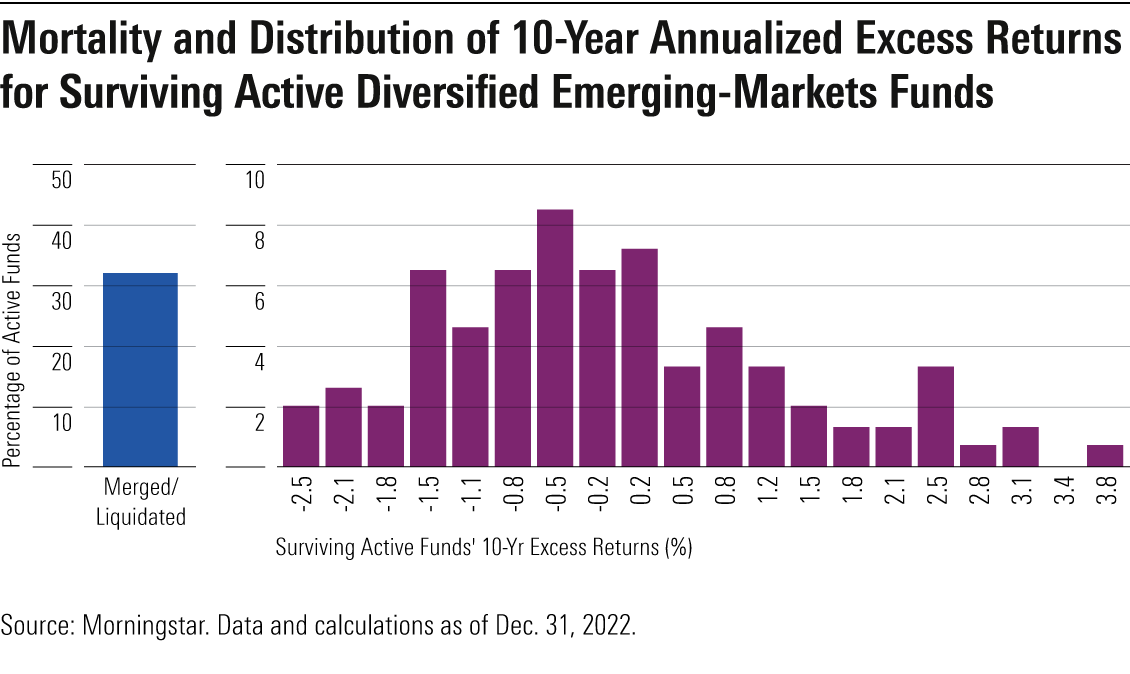
The opposite tends to be true of fixed-income, real estate, and certain foreign-stock categories, where long-term success rates have generally been higher and excess returns among surviving active managers skewed positive over the past decade. Exhibits 3 and 4 show the distributions of excess returns for surviving active funds from the large-blend and diversified emerging-markets categories.
Costs Matter for Both Passive and Active Strategies
The signal that rings loud and clear in this dataset is that fees matter. The cheapest funds succeeded more than twice as often as the priciest ones (36% success rate versus 16%) over the 10-year period through 2022. This not only reflects cost advantages but also differences in survival, as 67% of the cheapest funds survived, whereas 59% of the most expensive did so.
If there’s one near certainty for investors, it is “you get what you don’t pay for,” as the Vanguard’s late founder Jack Bogle said.
The author or authors do not own shares in any securities mentioned in this article. Find out about Morningstar’s editorial policies.
/cloudfront-us-east-1.images.arcpublishing.com/morningstar/OMVK3XQEVFDRHGPHSQPIBDENQE.jpg)
/cloudfront-us-east-1.images.arcpublishing.com/morningstar/AGAGH4NDF5FCRKXQANXPYS6TBQ.png)
:quality(80)/s3.amazonaws.com/arc-authors/morningstar/0fa19b38-60f6-4a0f-9e06-9869d9c57d52.jpg)