
How Rising Interest Rates Change the Relationship Between Stocks and Bonds
A closer link between the two asset classes reduces the benefit of including both in a portfolio.
/s3.amazonaws.com/arc-authors/morningstar/360a595b-3706-41f3-862d-b9d4d069160e.jpg)
Most readers are probably familiar with the basic math behind interest rates and bond prices: When interest rates go up, bond prices go down. As the market recalibrates what a bond’s future cash flows are currently worth, a higher discount rate reduces the value of future coupon payments, resulting in lower bond prices.
But there’s also a secondary impact on correlation, which is a statistical measure that captures how different securities or asset classes move in relation to each other. Combining asset classes that have correlations below 1.0—meaning they don’t tend to move in the same direction all the time—can reduce a portfolio’s overall risk profile.
In our recently published 2024 Diversification Landscape report, Christine Benz, Karen Zaya, and I took a deep dive into how different asset classes performed in the past couple of years, how correlations have evolved, and what those changes mean for investors and financial advisors trying to build well-diversified portfolios. One key finding: Rising interest rates typically lead to closer links between stocks and bonds, reducing the benefit of including both in a portfolio.
Interest-Rate Pivots
To measure the impact of interest rates on stock/bond correlations, we looked at correlation trends over the past six decades. During this period, policymakers sought to keep the economy stable during four widely acknowledged monetary policy regimes—the Great Inflation, Volcker Reform, the Great Moderation, and Zero Interest-Rate Policy, or ZIRP. We also looked at the most recent period of rising interest rates (which we dubbed The Great Unknown), which started in March 2022.
Within each of these regimes, there are concentrated periods of interest-rate pivots, or stress periods when the interest-rate regime resets. We defined these periods as months when both the 10-year US Treasury yield and the effective Federal Open Market Committee rate increased by 10% or more, year over year.
Over the single six-decade period, the correlation coefficient between stocks and bonds registered at a modest but positive 0.10. But as shown in the chart below, correlations between stocks and bonds have moved up and down quite a bit over shorter periods. The most acute spikes in correlation happened during concentrated periods of interest-rate stress.
Rolling Three-Year Stock/Bond Correlations
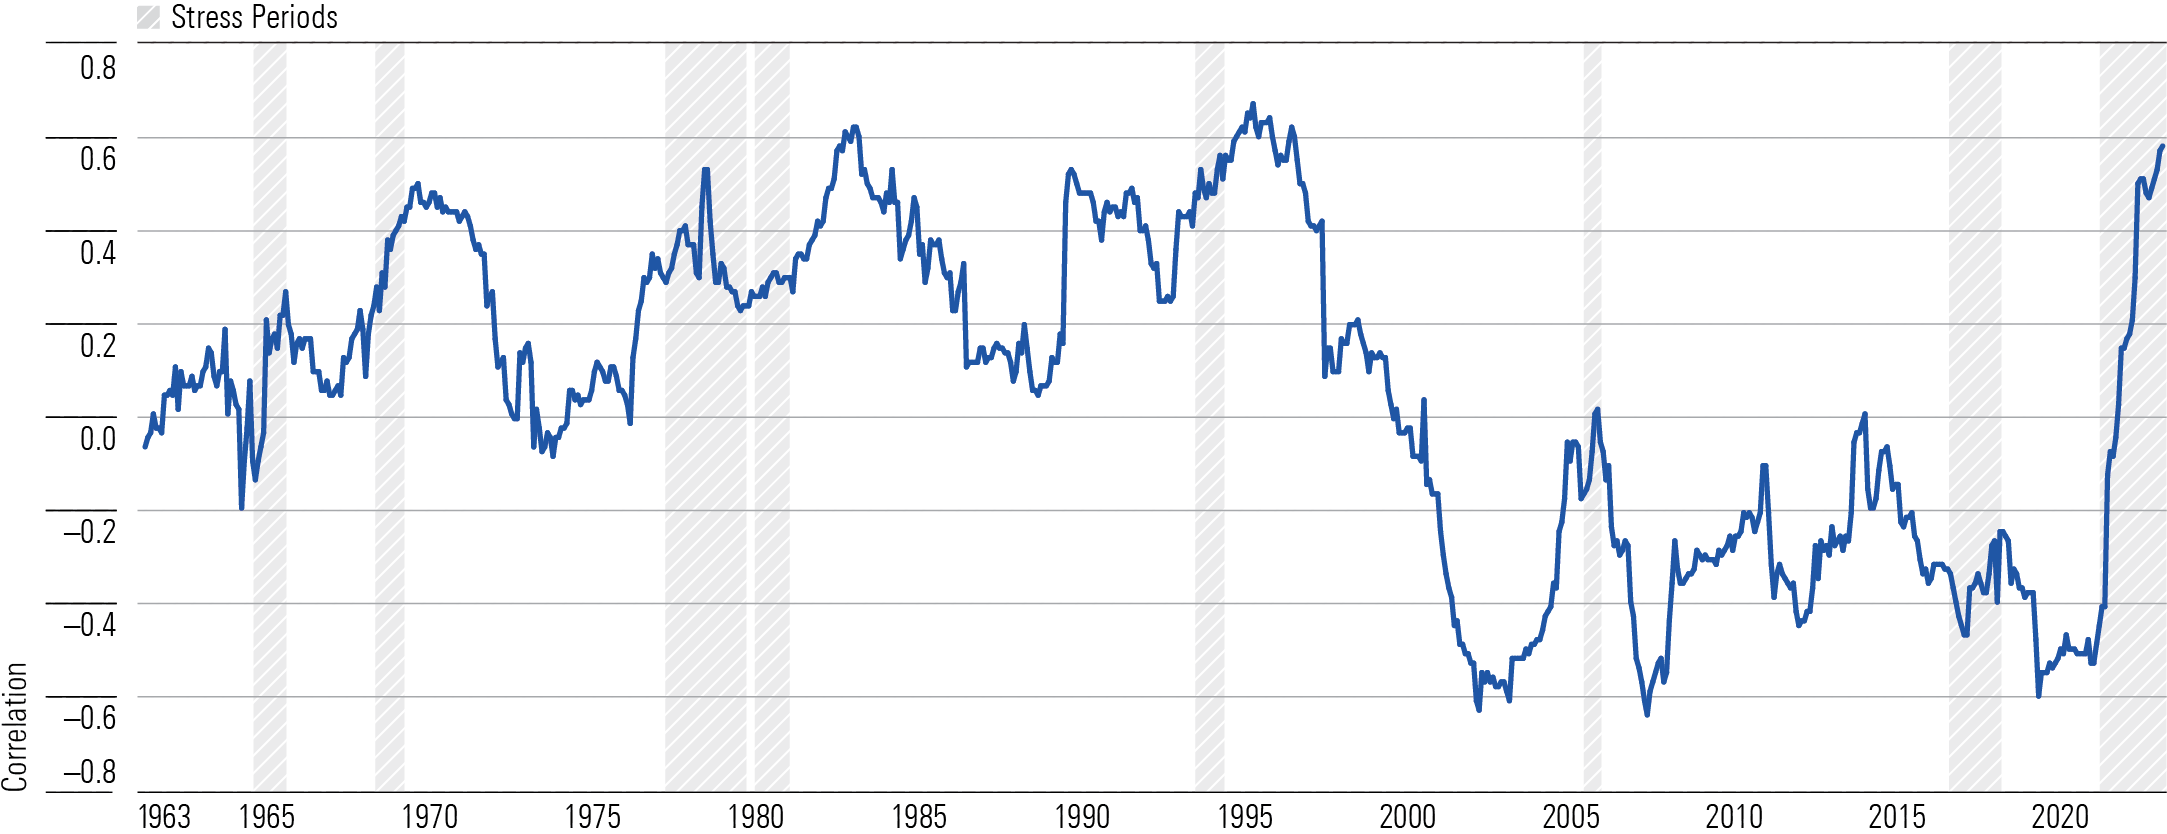
When the market expects borrowing costs to climb, correlations between stocks and bonds typically increase. From a mechanical perspective, cash flows are discounted by investors at higher rates, thereby decreasing the current value of both stocks and bonds. Moreover, higher interest rates often damp consumer and corporate spending, which in turn can slow the economy and reduce corporate profitability. While all fixed-rate bonds are usually stressed in this situation, longer-maturity bonds that carry significant duration (a measure of interest-rate risk) are at the greatest disadvantage when rates climb.
This pattern has been evident during the most recent period of interest-rate hikes. Correlations between stocks and bonds rose to 0.64—a significant increase from negative 0.24 during the zero-interest rate policy era, which spanned January 2009 through February 2022.
Risk, Returns, and Correlations: Interest-Rate Pivots
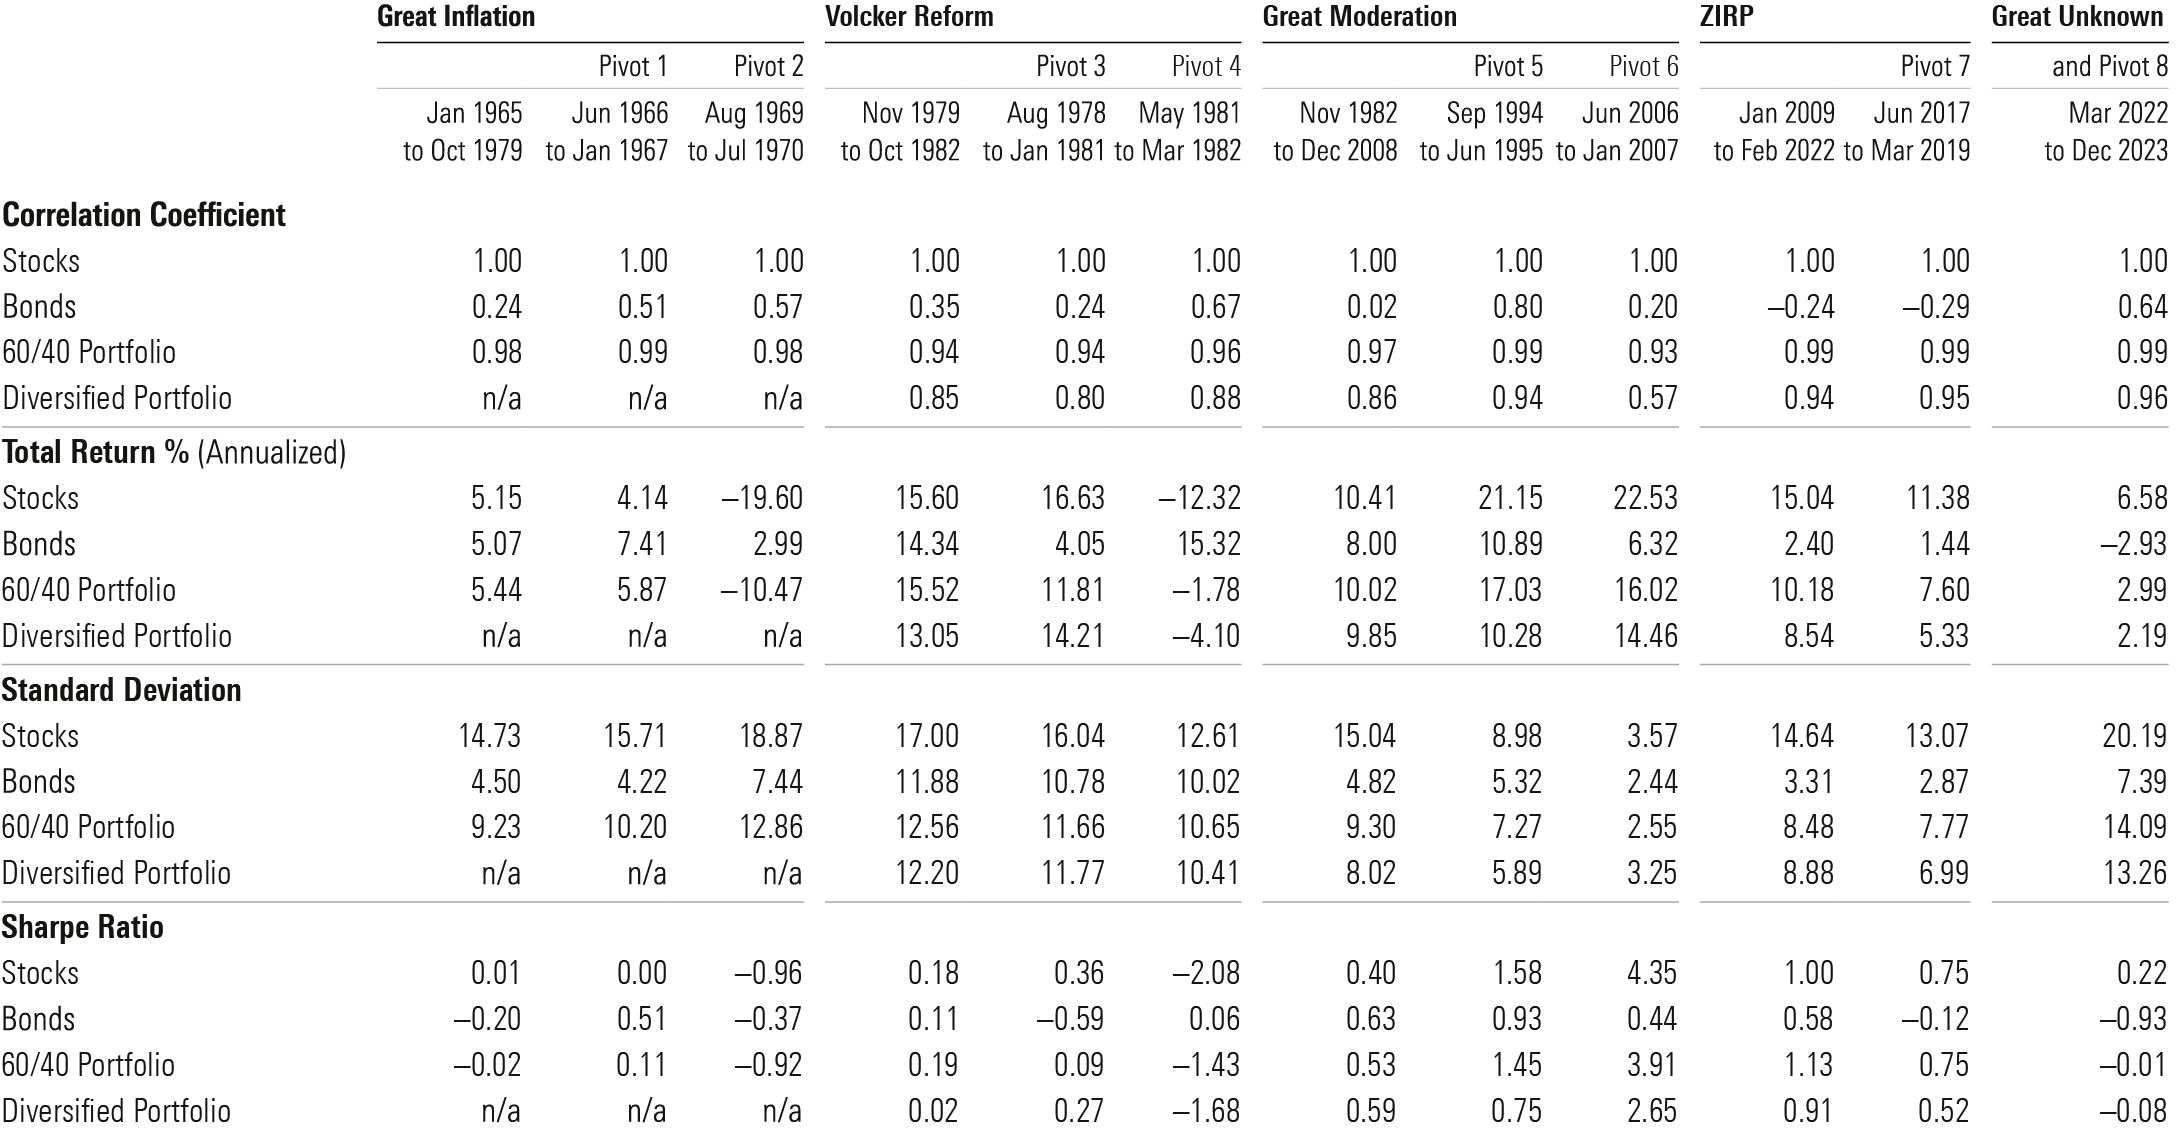
As the Federal Reserve began aggressively raising rates in 2022 (spanning from March to December), the correlation coefficient between stocks and bonds was quick to respond. Rather than maintain a period of low rates indefinitely, the Federal Reserve moved quickly to reset rates, faster and higher than it had in decades. While rate increases in 2023 were more moderate, the recalibration has remained a significant driver behind higher stock and bond correlations.
Paradoxically, investors should find interest-rate pivots encouraging. Although painful, without these, bonds would lose their long-term diversification benefits. Inflation combined with persistently low rates detracts from a US Treasury bond’s income-generating ability. And when rates sit at or near zero, the expectation that they must rise to restore elements of economic equilibrium fuels volatility in bond prices, too. Nobody wants to hold a bond knowing that aggressive rate increases are on the horizon. A higher rate reset now creates better opportunities for bonds later. Indeed, higher bond yields heading into 2023 helped offset losses from continued rate increases during the first seven months of the year.
In addition, painful interest-rate pivots are typically short. Indeed, the rolling three-year correlation between stocks and bonds equaled or exceeded 0.30 in only 30% of the six decades of monthly data points analyzed here. That’s attractive relative to other asset classes often used as portfolio diversifiers, such as REITs, high-yield bonds, and international equities. And between the interest-rate pivots identified in the table above, it took rolling three-year correlations anywhere from one to eight years to fall to a reset low, but they did eventually fall. Well-diversified portfolios with long time horizons benefit from patience.
Portfolio Implications
Although rising interest rates lead to closer links between stocks and bonds, anticipating the magnitude of a rate rise and the length of time for the climb is difficult. In fact, many professional investors manage strategies as duration-neutral to a chosen benchmark given the difficulty in calling interest-rate changes. However, nimble investors may mitigate the pain from rising rates with some thoughtful planning. For example, rotating out of longer-duration bonds or funds and into intermediate- or short-duration alternatives will reduce potential volatility during interest-rate spikes. Retirees who are in drawdown mode, meanwhile, should consider employing cash and short-term bonds alongside their intermediate- and longer-duration core bond holdings. That way they can pull from investments that are unlikely to experience significant losses in a period of rising rates.
It’s also useful to consider diversifying within the bond portfolio. It’s challenging to do that without introducing other risks, but investors can often benefit from an actively managed bond strategy with a shrewd, well-resourced manager and a disciplined process. A portfolio manager with the right tools can swiftly adjust her bond portfolio in small but meaningful ways (such as adding broader diversification across sectors or geographies), while an index fund has far less flexibility to sidestep the inevitable.
As interest-rate pivots wind down, it’s worth keeping an eye on the changing opportunity set. Now that yields on cash are significantly higher than they were heading into 2022, investors have an opportunity to derisk their portfolios without damaging returns, at least in the short term. And most importantly, it’s helpful to keep in mind that diversification benefits accrue, slowly and steadily, over decades and through interest-rate pivots. That is the secret sauce behind the enduring strength of the basic 60/40 portfolio, which has often generated more attractive risk-adjusted returns than a portfolio of only stocks or bonds over the past six decades.
The author or authors do not own shares in any securities mentioned in this article. Find out about Morningstar’s editorial policies.
/cloudfront-us-east-1.images.arcpublishing.com/morningstar/EC7LK4HAG4BRKAYRRDWZ2NF3TY.jpg)
/cloudfront-us-east-1.images.arcpublishing.com/morningstar/6ZMXY4RCRNEADPDWYQVTTWALWM.jpg)
/cloudfront-us-east-1.images.arcpublishing.com/morningstar/URSWZ2VN4JCXXALUUYEFYMOBIE.png)
:quality(80)/s3.amazonaws.com/arc-authors/morningstar/360a595b-3706-41f3-862d-b9d4d069160e.jpg)