
They Came. They Saw. They Incinerated Half Their Funds’ Potential Returns.
Tactical allocation funds of funds would have earned twice as much if their managers didn’t trade over the past decade.
/s3.amazonaws.com/arc-authors/morningstar/550ce300-3ec1-4055-a24a-ba3a0b7abbdf.png)

In recent weeks, we’ve written several articles about how a strategy of doing nothing—eschewing trading and letting investments ride—would have fared. To sum up, we found a do-nothing strategy would have improved the risk-adjusted performance of the S&P 500 index’s holdings as well as the portfolio of stocks that active large-cap funds held in aggregate.
What we didn’t examine was whether a do-nothing approach would yield similar results if applied to asset classes. For instance, if one were to take a portfolio divvied up between stocks, bonds, and other assets and make no changes to it, would that do-nothing allocation outperform the actual managed multi-asset strategy? To answer that question, we put tactical asset allocation funds of funds to the test.
Why tactical allocation funds? In a sense, they’re the quintessential “managed” multi-asset strategy, as the managers frequently adjust the funds’ asset-allocation exposures depending on their market forecasts or other factors. We chose fund-of-funds because it’s easier to calculate the do-nothing performance of these funds than those that spread their assets among individual stocks, bonds, and derivative instruments.
There were 34 of these tactical funds, excluding multiple share classes, as of April 30, 2013. We took a snapshot of each fund’s portfolio as of that date (or the next-soonest date it reported its portfolio holdings) and then calculated the holdings’ performance over the ensuing 10 years ended April 30, 2023, employing the same calculation approach as in our other do-nothing tests.
Not a Pretty Picture
One thing that’s quickly evident about these tactical funds is that they were stinkers: The average fund gained a measly 2.3% per year over the decade ended April 30, 2023, roughly a third that of the U.S. 60% stocks/40% bonds mix. (We use Vanguard Balanced Index as a proxy for the 60/40 allocation.) What’s more, most of these tactical funds didn’t survive to the end of the period: Of the 34, 22 died along the way. (Note: The 2.3% return incorporates the dead funds’ performance.)
Average Tactical Allocation Fund of Funds vs. U.S. 60/40 Allocation
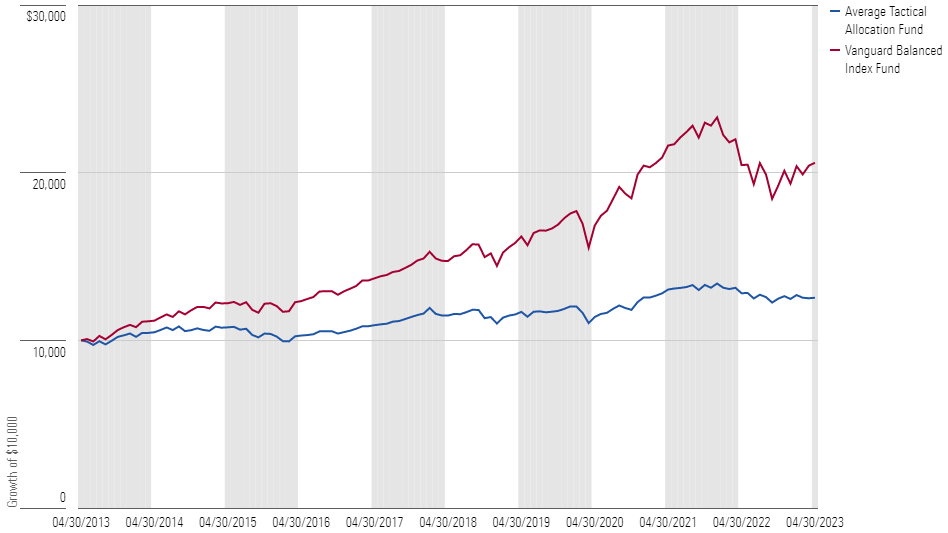
Among the dozen funds that lived to the end, not one generated a higher return or Sharpe ratio than the U.S. 60/40 mix, a dismal showing.
The Do-Nothing Results
While these results immediately cast doubt on the prudence of tactical asset allocation, the question is whether these funds would have been better off had the managers stood down over the 10-year period. The short answer is yes—the do-nothing strategy would have generated a roughly 4.6% per year return, double that of the actual funds.
Growth of $10,000: Average Tactical Asset Allocation Fund vs. Do-Nothing Tactical Allocation Strategy
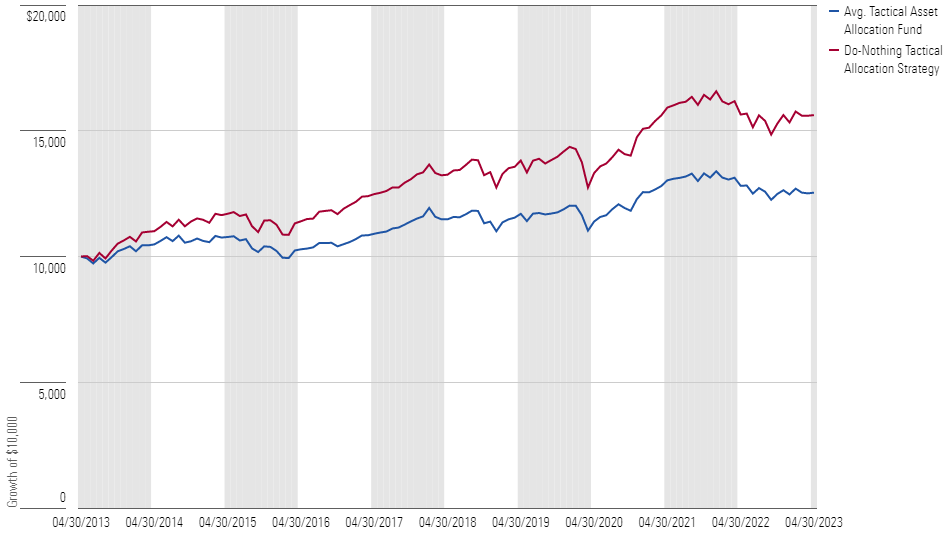
The do-nothing strategy was slightly more volatile, but its risk-adjusted performance still handily surpassed the average actual tactical fund’s, even if that still left it well shy of the traditional U.S. 60/40 portfolio.
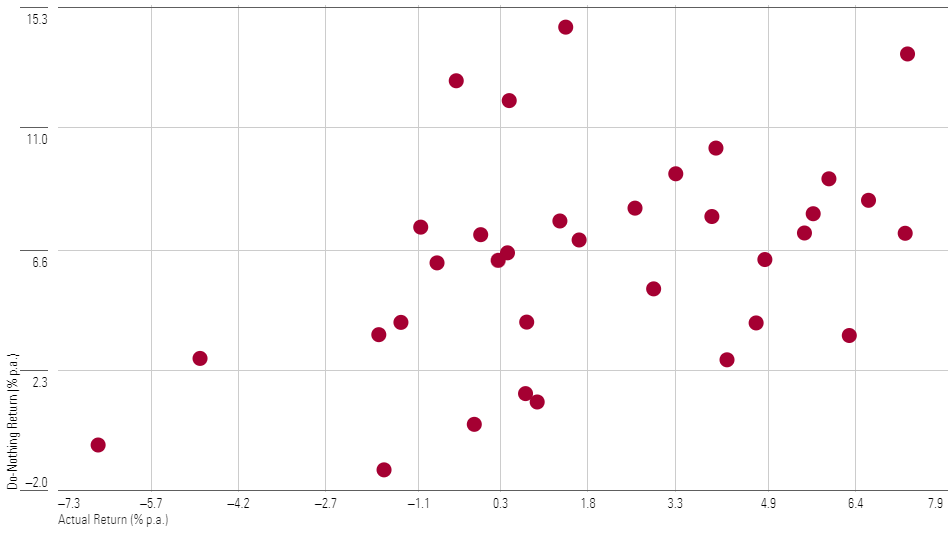
When we examined the fund-by-fund performance, it was remarkably consistent, and not in a good way: Of the 34 tactical funds, 30 generated worse returns than if the managers had done nothing at all, the average shortfall being about 4.4% per year. Funds that managed to survive the full period lagged by a bit less (2.2%) than those that died (5.6%), but nearly every manager’s trades subtracted value.
Comparing Tactical Allocation Funds-of-Funds Actual and Do-Nothing Returns
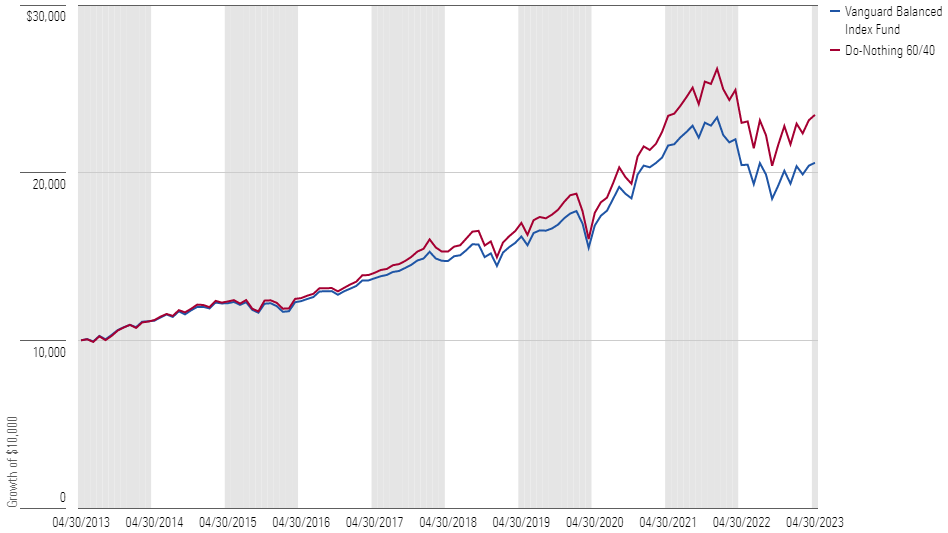
To be fair, even the U.S. 60/40 destroyed value. Indeed, we found the do-nothing version of the 60/40—that is, the portfolio that began with 60% in U.S. stocks and 40% in domestic investment-grade bonds and then was left untouched—would have gained about 8.9% per year over the 10 years ended April 30, 2023, or about 140 basis points better than the actual 60/40 (proxy for which is Vanguard Balanced Index). It also earned a higher Sharpe ratio. What explains that? The do-nothing didn’t rebalance away from U.S. stocks like the actual 60/40 did, and that boosted performance.
Growth of $10,000: Vanguard Balanced Index Fund vs. Do-Nothing 60/40
Nevertheless, tactical allocation funds sell themselves on the promise of knowing in advance which areas to emphasize and which to avoid. That promise has gone largely unmet, as these funds have typically underperformed simpler strategies, like the classic U.S. 60% stocks/40% bonds mix.
But this is the first time we’ve sought to estimate the extent to which these managers’ trading decisions added to, or subtracted from, the funds’ returns. Based on the simple test we conducted, it appears they’ve subtracted value, costing investors about half of the return they could have earned if the manager had done nothing at all.
These costly trading errors, coupled with the higher fees that these funds tend to levy when compared with low-cost target-risk funds, bode very poorly for the future.
The author or authors do not own shares in any securities mentioned in this article. Find out about Morningstar’s editorial policies.
/cloudfront-us-east-1.images.arcpublishing.com/morningstar/6ZMXY4RCRNEADPDWYQVTTWALWM.jpg)
/cloudfront-us-east-1.images.arcpublishing.com/morningstar/URSWZ2VN4JCXXALUUYEFYMOBIE.png)
/cloudfront-us-east-1.images.arcpublishing.com/morningstar/CGEMAKSOGVCKBCSH32YM7X5FWI.png)
:quality(80)/s3.amazonaws.com/arc-authors/morningstar/550ce300-3ec1-4055-a24a-ba3a0b7abbdf.png)