
Large-Growth Stocks Are Overvalued. Small-Value Stocks Are Undervalued. Here’s Why It Matters
A look at the implications for expected returns.
/s3.amazonaws.com/arc-authors/morningstar/8c5d95ea-6364-418e-82fc-473134024ece.jpg)

As head of financial and economic research at Buckingham Wealth Partners, I have been getting lots of questions about the continuing outperformance of US large-growth stocks. It’s not surprising given that from January 2012 through March 2024, the Russell 1000 Large Growth Index outperformed the Russell 1000 Large Value Index by 5.49 percentage points per year (17.01% versus 11.52%), and it outperformed the Russell 2000 Growth and Value indexes by 6.17 percentage points (17.01% versus 10.84%) and 7.21 percentage points (17.01% versus 9.80%) per year, respectively. Influenced by what behavioralists call “recency bias,” such wide differences in performance often lead investors to abandon even well-thought-out plans because they project the recent performance into the future as if it were inevitable.
Unfortunately, that recency bias leads investors to ignore the fact that such large differences in performance are often driven by changes in relative valuations. With that in mind, let’s examine the current valuations of the strongest performer over the period, the Russell 1000 Growth Index, and the weakest performer, the Russell 2000 Value Index.
Using charts provided by Avantis, we see that as of the end of January 2024, the Russell 1000 Growth Index had a price/earnings ratio of 32.8, 36% above its average since 2000. At the same time, the Russell 2000 Value Index had a P/E ratio of just 11.0, 26% below its average of 14.9 since 2000. That change in relative valuations has been the major driver of the difference in returns. We see the same shift in relative valuations when we look at price/book ratios. The Russell 1000 Growth Index saw its price/book increase to 88% above its average of 5.8 since 2000, while the Russell 2000 Value Index saw its price/book fall 7% below its average since 2000 to 1.3.
Valuations of Large Growth vs. Large Value
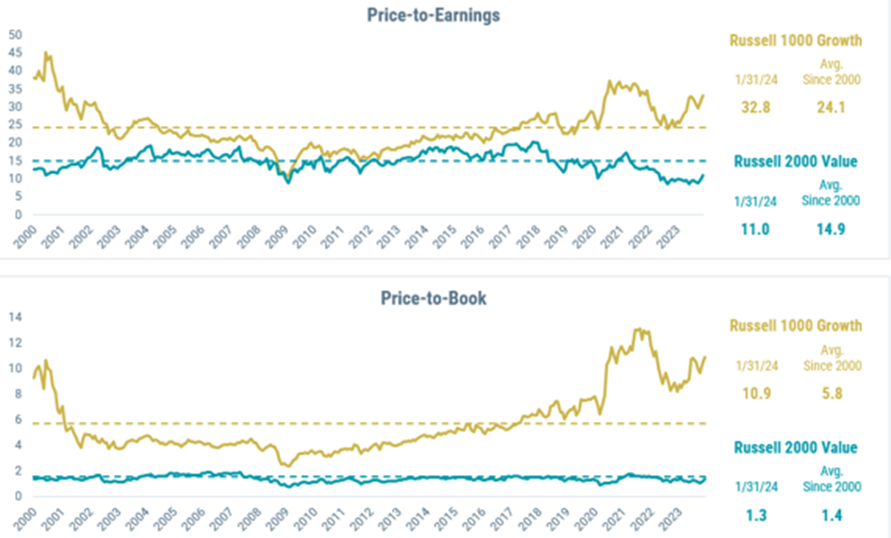
The result of the rise in valuations of large-growth stocks is that they are now trading well above historical averages. And the result of the decline in valuations of small-value stocks is that they are now trading well below historical valuations. This has important implications for future expected returns.
The Relationship Between Valuations and Future Returns
Simply put, valuations are the best predictor we have of future returns, and the longer the investment horizon, the larger the role of valuations. However, over short horizons, such as one year, current valuations have virtually no predictive value; the R-squared between the trailing 12-month P/E and the next year’s return is virtually zero for both the S&P 500 (R-squared = 0.05) and the S&P SmallCap 600 Value Index (R-squared = 0.02). However, as the horizon increases, so does the predictive value. At the five-year horizon, the R-squared for the S&P 500 increases to 0.18, and for the S&P SmallCap 600 Value it increases to 0.36.
Vanguard research confirmed that valuation metrics such as P/Es have had an inverse, or mean-reverting, relationship with future stock market returns, although it has only been meaningful at long horizons, explaining about 40% of the time variation in net-of-inflation returns. Its results were similar whether trailing earnings were smoothed or cyclically adjusted (as is done in Robert Shiller’s popular P/E 10 ratio). Forty percent is a high figure for an asset as important to investors as equities.
The same divergence in performance in the US between large and small stocks and growth and value stocks has also occurred between US stocks and international stocks.
Domestic Versus International Valuations
Over the same January 2012 through March 2024 period, the S&P 500 outperformed the MSCI EAFE Investable Market Index (net dividends) by 7.38 percentage points per year (14.56% versus 7.18%) and the MSCI Emerging Markets Investable Market Index (net dividends) by 8.45 percentage points per year (14.56% versus 6.11%). And once again we see the same pattern in changes in current valuations relative to historical valuations—valuation spreads between US and international large stocks at the end of 2023 were dramatically higher than historical averages because US valuations rose to well above their historical average and international valuations fell to below their historical average.
As we entered 2024, the price/earnings spread between the S&P 500 and MSCI EAFE IMI was 9.79, 136% greater than the average spread of 4.14 over the 2000-23 period. Similarly, the P/E spread between the S&P 500 and the MSCI Emerging Markets IMI had almost doubled from its average of 5.86 over the period, to 10.54. The same widening can be seen in the spreads in price/book ratios.
As we entered 2024, the price/book spread between the S&P 500 and MSCI EAFE IMI was 2.47, 109% greater than the average spread of 1.18 over the 2000-23 period. Similarly, the price/book spread between the S&P 500 and the MSCI Emerging Markets IMI had more than doubled from its average of 1.14 over the period, to 2.59 (an increase of 127%).
As noted, while valuations are not perfect predictors of future returns, they are by far the best metric we have. And even if today’s valuations do not predict the future, the changes in valuations we have seen are responsible for much of the performance differences from which investors extrapolate into the future. To believe this performance difference will continue (with growth stocks and the US outperforming), one has to believe the relative valuation increases will occur again from the current levels. (See Cliff Asness’ The Long Run is Lying to You.) With that in mind, we can look to the historical evidence to see what happened to future returns when valuation spreads similarly widened.
Been There, Done That
One of my favorite expressions is that what you don’t know about investing is the investment history you don’t know. There have been periods like this before, where the largest stocks contributed significantly to the overall market return and far outperformed other equities. However, the magnitude observed recently is not the norm, and neither is the length of time that the shift in valuations has persisted.
There has been a significant multiple expansion among the largest companies, leading to meaningful increases in valuation ratios and concentration among large-cap indexes (that is, more weight in stocks with less attractive valuations). Since valuations are a proxy for long-term expected returns, let’s examine the historical evidence in prior periods with similar experiences.
US Large Growth Versus Small Value
From 1995 through March 2000, the Dimensional US Large Growth Index outperformed the Dimensional US Small Value Index by 10.26 percentage points per year (28.81% versus 18.55%). Similar to recent experience, that divergence was driven mostly by a widening of the spread in valuations. Over the period, the P/E ratio of US large-growth stocks virtually doubled, from 15.8 to 30.30, while the P/E of small-value stocks increased by only about 5%, from 11.70 to 12.30. Similarly, while the price/book ratio of US large-growth stocks rose from 2.5 to 4.5 (an increase of 80%), the price/book ratio of US small-value stocks fell slightly from 1.08 to 1.06. Keeping in mind what we know about valuations and their relationship to future returns, we turn now to how the widening in spreads impacted future returns.
Over the period 2000-07, the Dimensional US Small Value Index outperformed the Dimensional Large Growth Index by 15.70 percentage points per year (16.38% versus 0.68%). It continued to outperform over the 2008-11 period, outperforming by 1.58 percentage points (4.11% versus 2.53%). The outperformance over the full 2000-11 period was 10.85 percentage points per year (12.14% versus 1.29%). Only those investors who were not influenced by recency bias and had the discipline to stay the course over the full period 1995-2011 benefited from the outperformance of 5.28 percentage points per year (13.99% versus 8.71%) of US small-value stocks over US large-growth stocks.
US Versus International Stocks
The research team at Avantis examined returns in the period before and after the last time (at the end of 2001) that US valuations were this high relative to international valuations.
Avantis found that over the 1970-2001 period, the MSCI USA Index had outperformed the MSCI World ex USA Index, 11.56% versus 10.91%, a difference of 0.65 percentage points per year. Over the next 10 years (2002-11), the MSCI World ex USA Index outperformed by 2.58 percentage points (5.56% versus 2.98%). That outperformance over just 10 years was sufficient to result in international stocks outperforming by 0.16 percentage points (9.64% versus 9.48%) over the full 42-year period.
Note that the dramatic outperformance of the US over the period 1990-2001 (12.85% versus 2.39%) resulted in the P/E of the S&P 500 being more than double that of the MSCI EAFE IMI (23.2 versus 11.2) and pushed the spread in the P/E to 12 (as noted earlier, the average spread over the period 2000-2023 was just 4.14). Digging a bit further into the data, over the next six years (2002-07), the MSCI EAFE IMI outperformed the S&P 500 by 8.26 percentage points per year (14.33% versus 6.07%).
Investor Takeaways
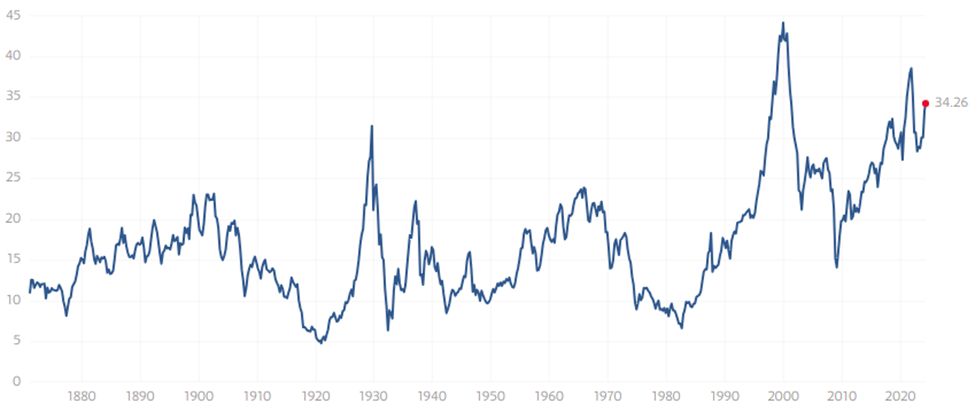
The most important takeaway is that valuations are a proxy for long-term expected returns. Thus, being mindful of them should lead to better outcomes. At the same time, we must recognize that over the short term, valuations have little predictive value as to returns. In fact, at the one-year horizon, they have virtually no predictive value, which means that even historically high valuations can go even higher. The historical evidence demonstrates that all risky assets experience long periods of underperformance. For example, there were three periods (1929-47, 1966-82, and 2000-17) of at least 17 years when the S&P 500 underperformed five-year Treasuries. All three periods began with the 10-year cyclically adjusted P/E ratio, or Shiller P/E ratio, for the S&P 500 at historically high valuations (27.7 in January 1929, 23.7 in January 1966, and 42.18 in January 2000).
Shiller P/E Ratio
Such long periods can cause investors to believe that “this time it’s different” (perhaps the four most dangerous words in investing), creating the risk of investors becoming subject to recency bias and abandoning well-thought-out plans.
The fact that every single risk asset goes through such long periods of underperformance, and there is no evidence that investors can forecast when such regimes will change, is the reason we diversify the sources of risk in a portfolio—eliminating the risk that all our investments are in the wrong basket at the wrong time. The solution is to build a broadly diversified portfolio that includes unique sources of risk and stay the course.
However, while diversification has been called the “only free lunch in investing,” it doesn’t eliminate the risk of losses. And it does require that investors accept that parts of their portfolio will behave entirely differently than the portfolio itself and may underperform a broad market index (such as the S&P 500) for a very long time. Knowing your level of tolerance for tracking variance risk and investing accordingly will help keep you disciplined. The less tracking variance you are willing to accept, the more the equity portion of your portfolio should look like the S&P 500. On the other hand, if you choose a marketlike portfolio, it will not be very diversified by asset class and will have no international diversification. At least between these two choices (avoiding or accepting tracking variance), there is no free lunch. It is almost as important to get this balance right as it is to determine the appropriate equity/fixed-income allocation. If you have the discipline to stick with a globally diversified, passive asset-class strategy, you are likely to be rewarded.
A wise person once said that if some part of your portfolio isn’t performing poorly, you are not properly diversified. As Asness noted in his thought piece Liquid Alt Ragnarök?, “Losing unconventionally is hard.” I would add that because misery loves company, losing unconventionally is harder than failing conventionally. Asness also observed that living through hard times is harder than observing them in backtests. That difficulty helps explain why it’s so hard to be a successful investor. It’s our behavioral biases and the mistakes we make because we don’t know the historical evidence.
It is always a good idea to be a skeptical investor. Thus, there is nothing wrong with questioning a strategy after a long period of underperformance. With that in mind, you should ask if any of the assumptions behind your strategy are no longer valid, or if the risks just happened to show up. Seek the truth, whether it aligns with your beliefs or not. For investors, the truth lies in the data on persistence, pervasiveness, robustness, implementability, and especially intuitiveness.
To help you stay disciplined and avoid the consequences of recency, I offer the following suggestion. Whenever you are tempted to abandon your well-thought-out investment plan because of poor recent performance, ask yourself this question: Having originally purchased and owned this asset when valuations were higher and expected returns were lower, does it make sense to now sell the same asset when valuations are currently much lower and expected returns are now much higher? The answer should be obvious. If that’s not sufficient, remember Warren Buffett’s advice to never engage in market-timing, but if you cannot resist the temptation, then you should buy when others panic.
Larry Swedroe is a freelance writer. The opinions expressed here are the author’s. Morningstar values diversity of thought and publishes a broad range of viewpoints.
The author or authors do not own shares in any securities mentioned in this article. Find out about Morningstar’s editorial policies.
/cloudfront-us-east-1.images.arcpublishing.com/morningstar/EC7LK4HAG4BRKAYRRDWZ2NF3TY.jpg)
/cloudfront-us-east-1.images.arcpublishing.com/morningstar/6ZMXY4RCRNEADPDWYQVTTWALWM.jpg)
/cloudfront-us-east-1.images.arcpublishing.com/morningstar/URSWZ2VN4JCXXALUUYEFYMOBIE.png)
:quality(80)/s3.amazonaws.com/arc-authors/morningstar/8c5d95ea-6364-418e-82fc-473134024ece.jpg)