Top 10 Things to Know About Building a Diversified Portfolio
Here’s how some key asset classes fare as portfolio diversifiers and what that means for building your portfolio.

Diversification is a core principle of sound investing. A portfolio that includes assets with different performance characteristics often leads to better risk-adjusted returns than one that relies on a single asset class. But building a diversified portfolio can be easier in theory than practice.
In our recently published 2024 Diversification Landscape report, my colleagues Christine Benz, Karen Zaya, and I took a deep dive into the diversification potential of several major asset classes. Here are some of the key lessons from our research that investors can apply to improve their portfolios.
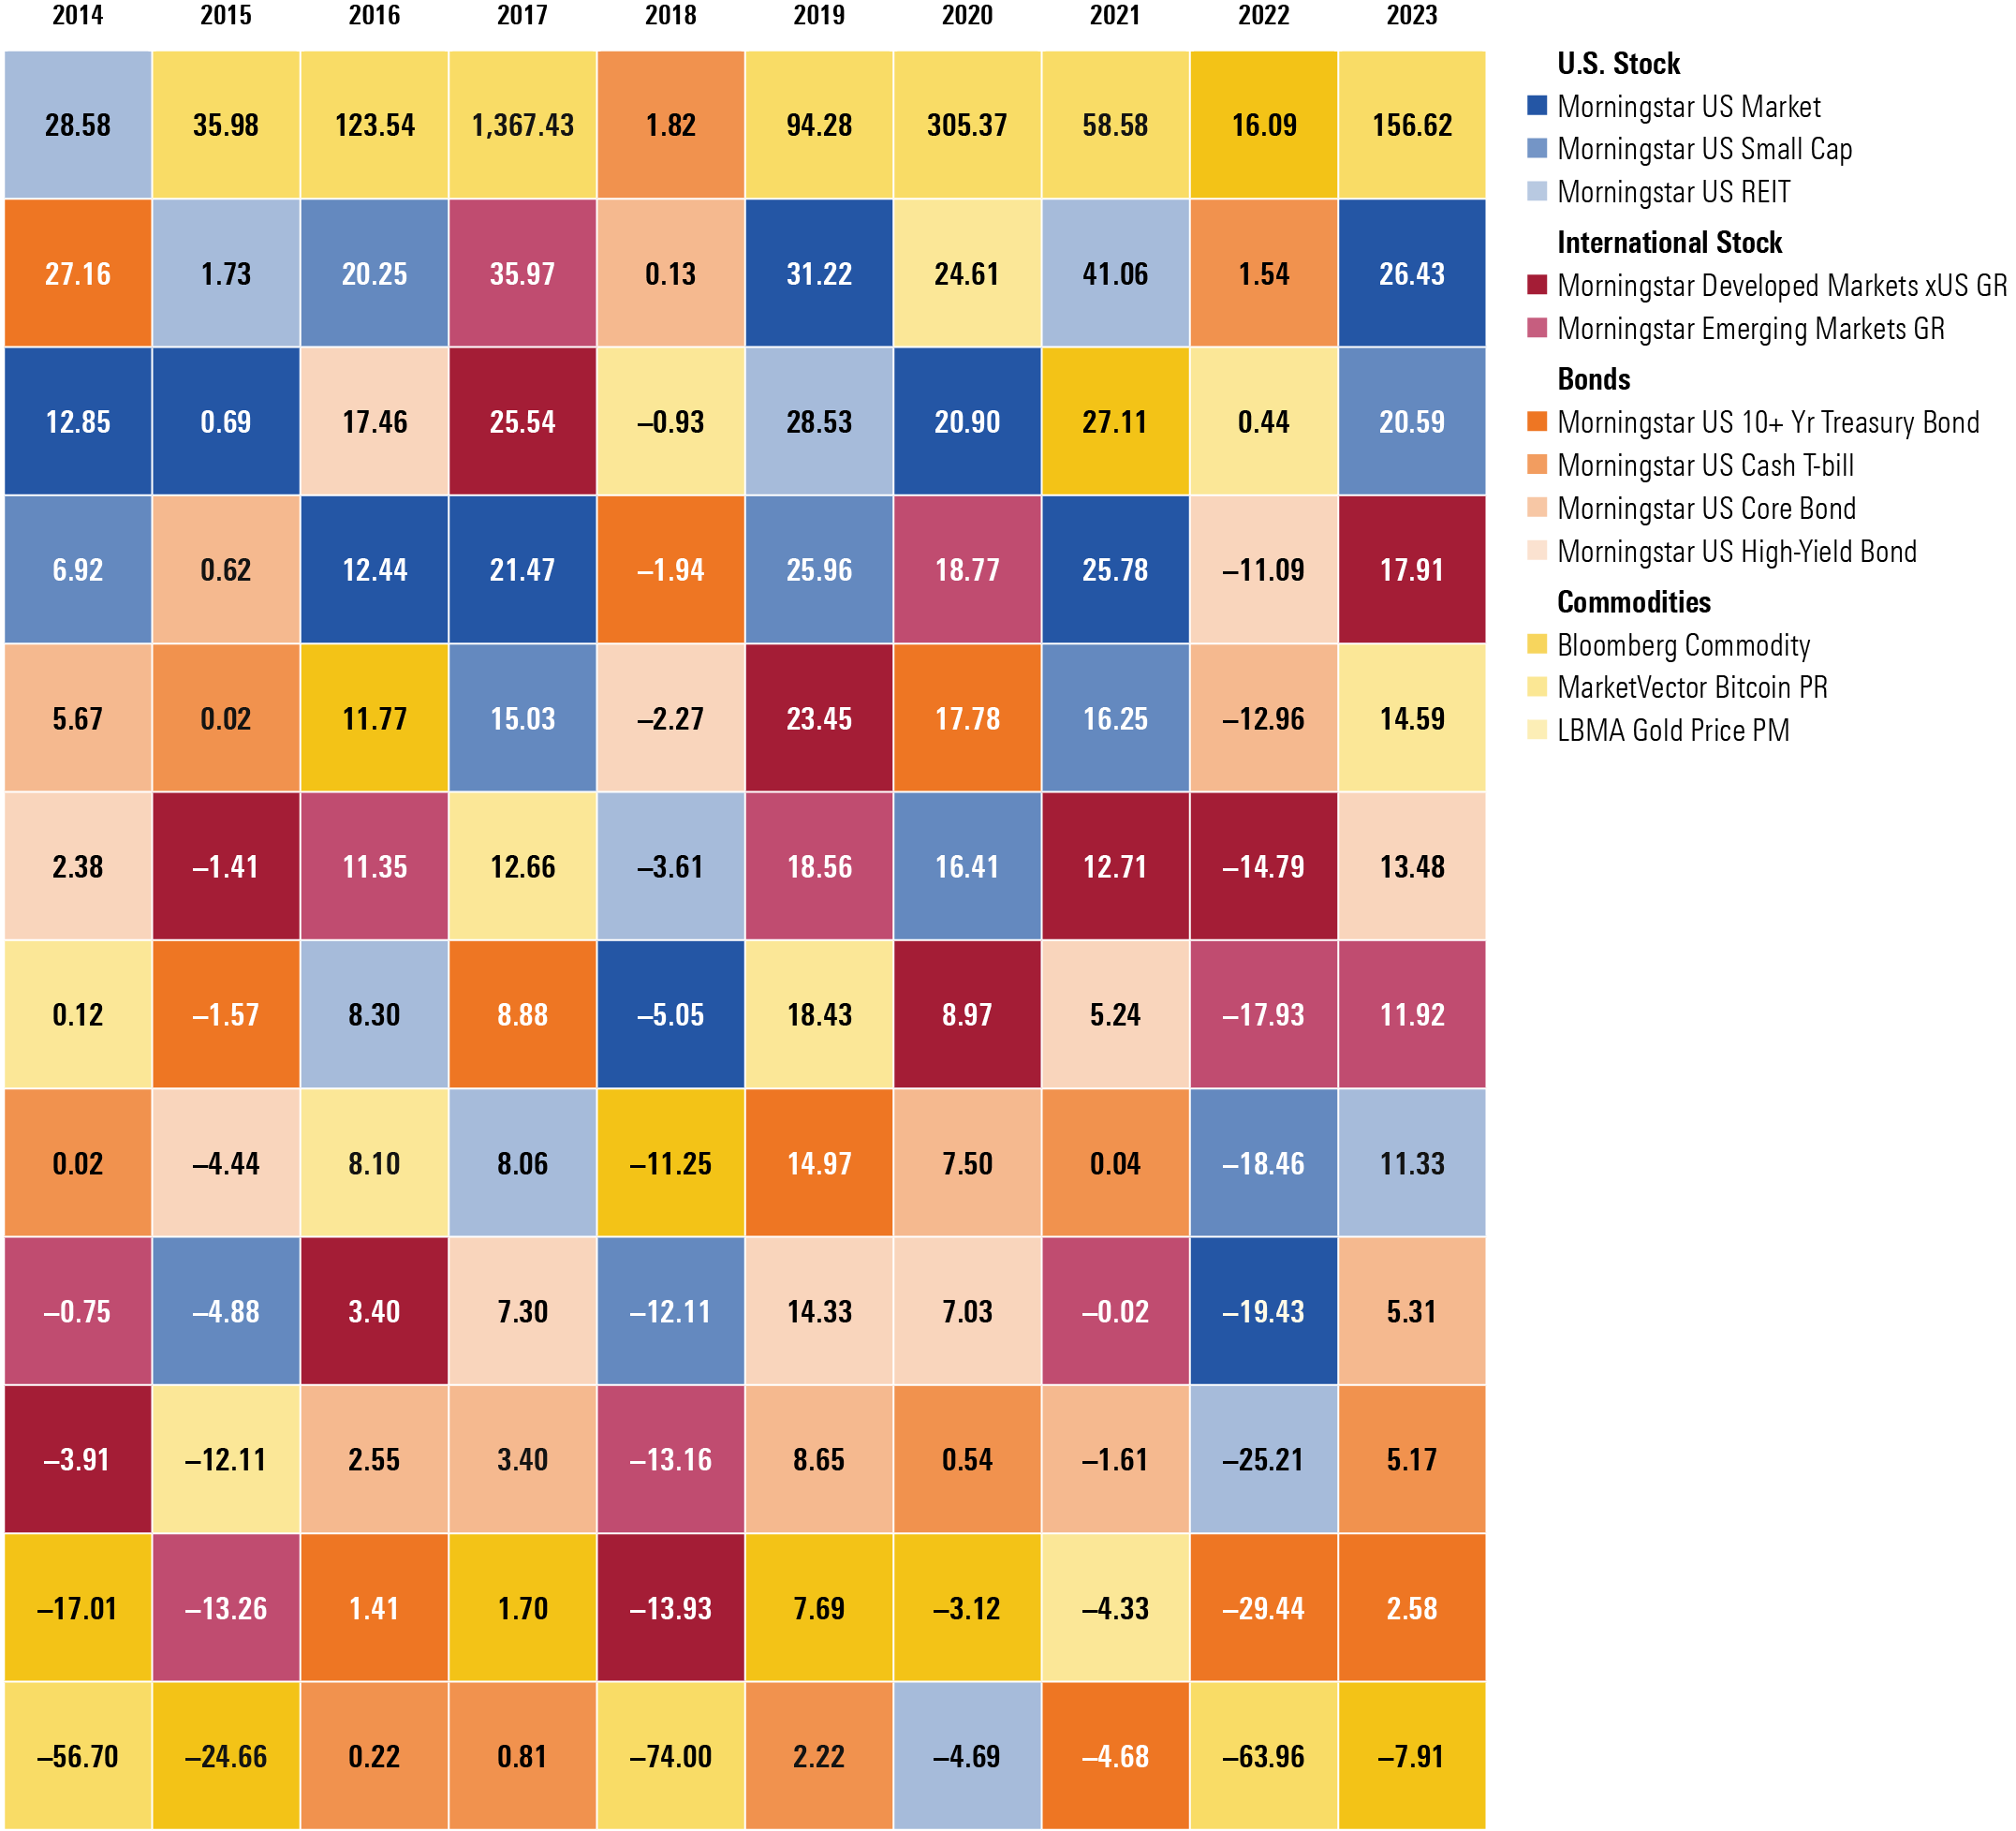
1. It’s impossible to predict which asset class will do well (or not) in any given year. Areas that are winners in one year often sink to the bottom in later years. Holding a variety of asset classes helps guard against being overly exposed to an area that falls out of favor.
Asset-Class Winners and Losers (Annual Total Return %)
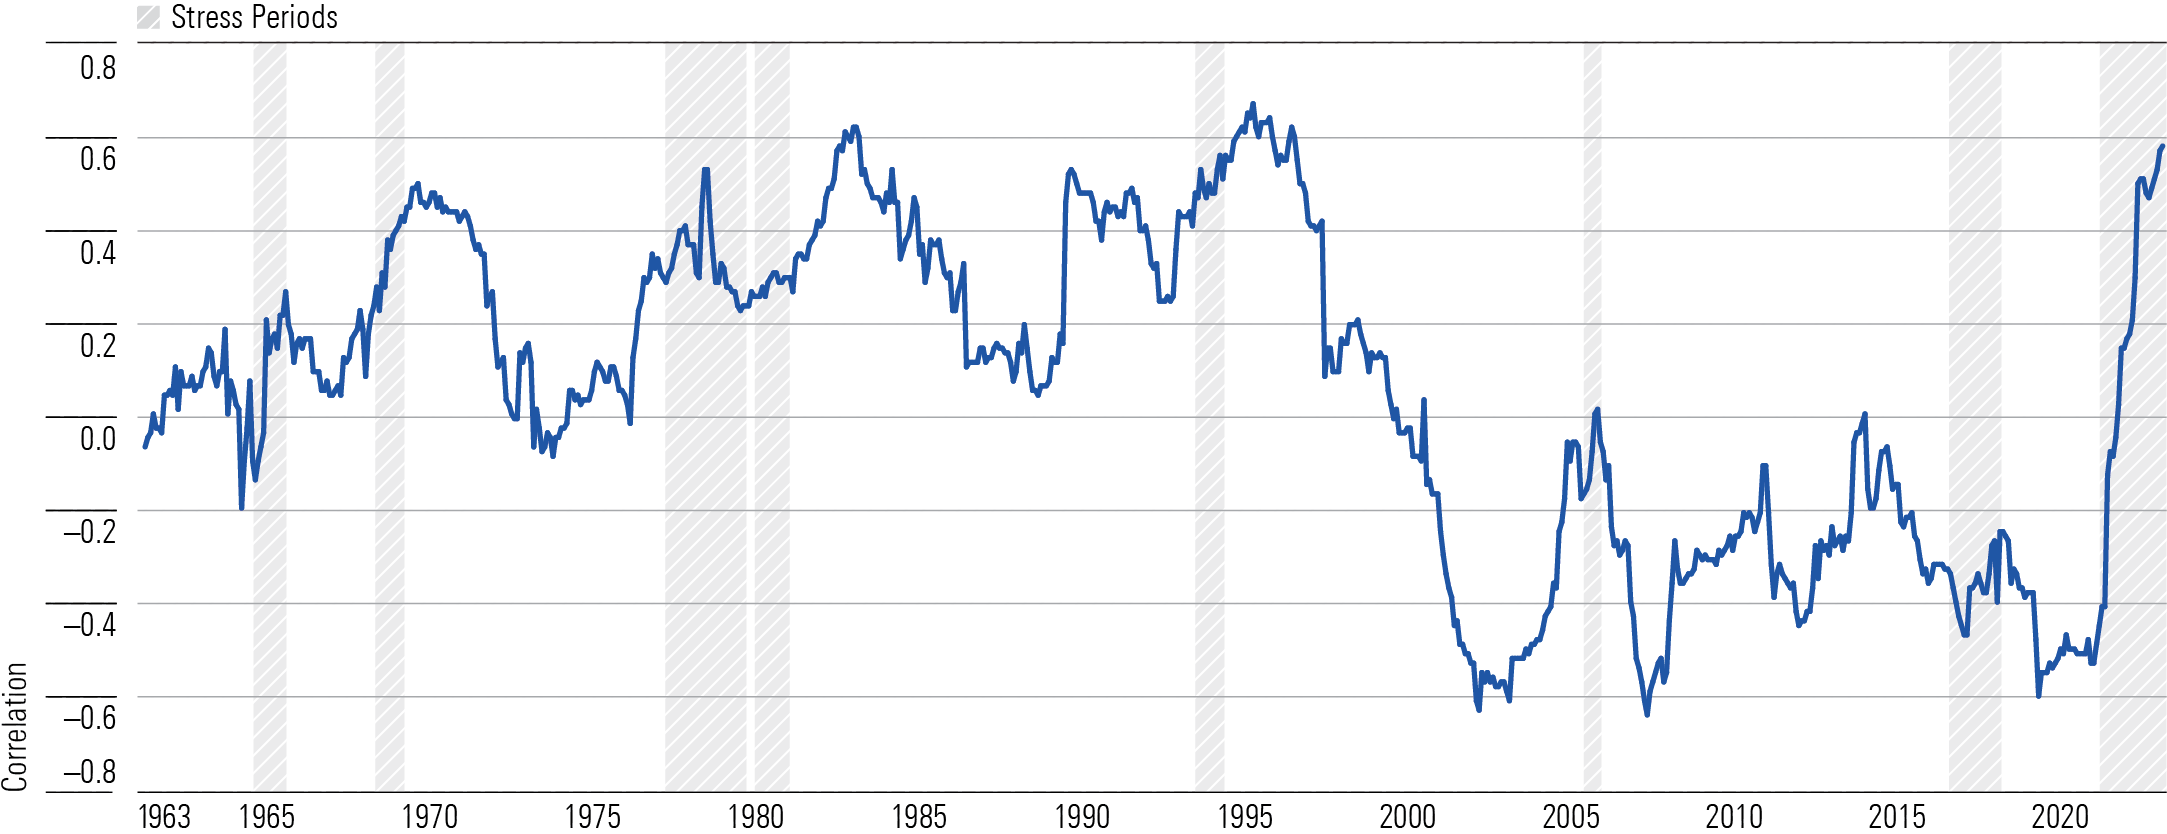
2. Correlations between stocks and bonds have increased, but bonds still provide diversification benefits. As the Federal Reserve began aggressively raising rates in 2022, stocks and bonds began moving more closely in tandem. Over the 24-month period from 2022 to 2023, correlations between the two major asset classes rose to about 0.6, compared with a longer-term average near zero. But while bonds now provide less of a diversification benefit than in the past, they still have a lower correlation versus US stocks than most other major asset classes.
Rolling Three-Year Correlations: Bonds vs. Stocks
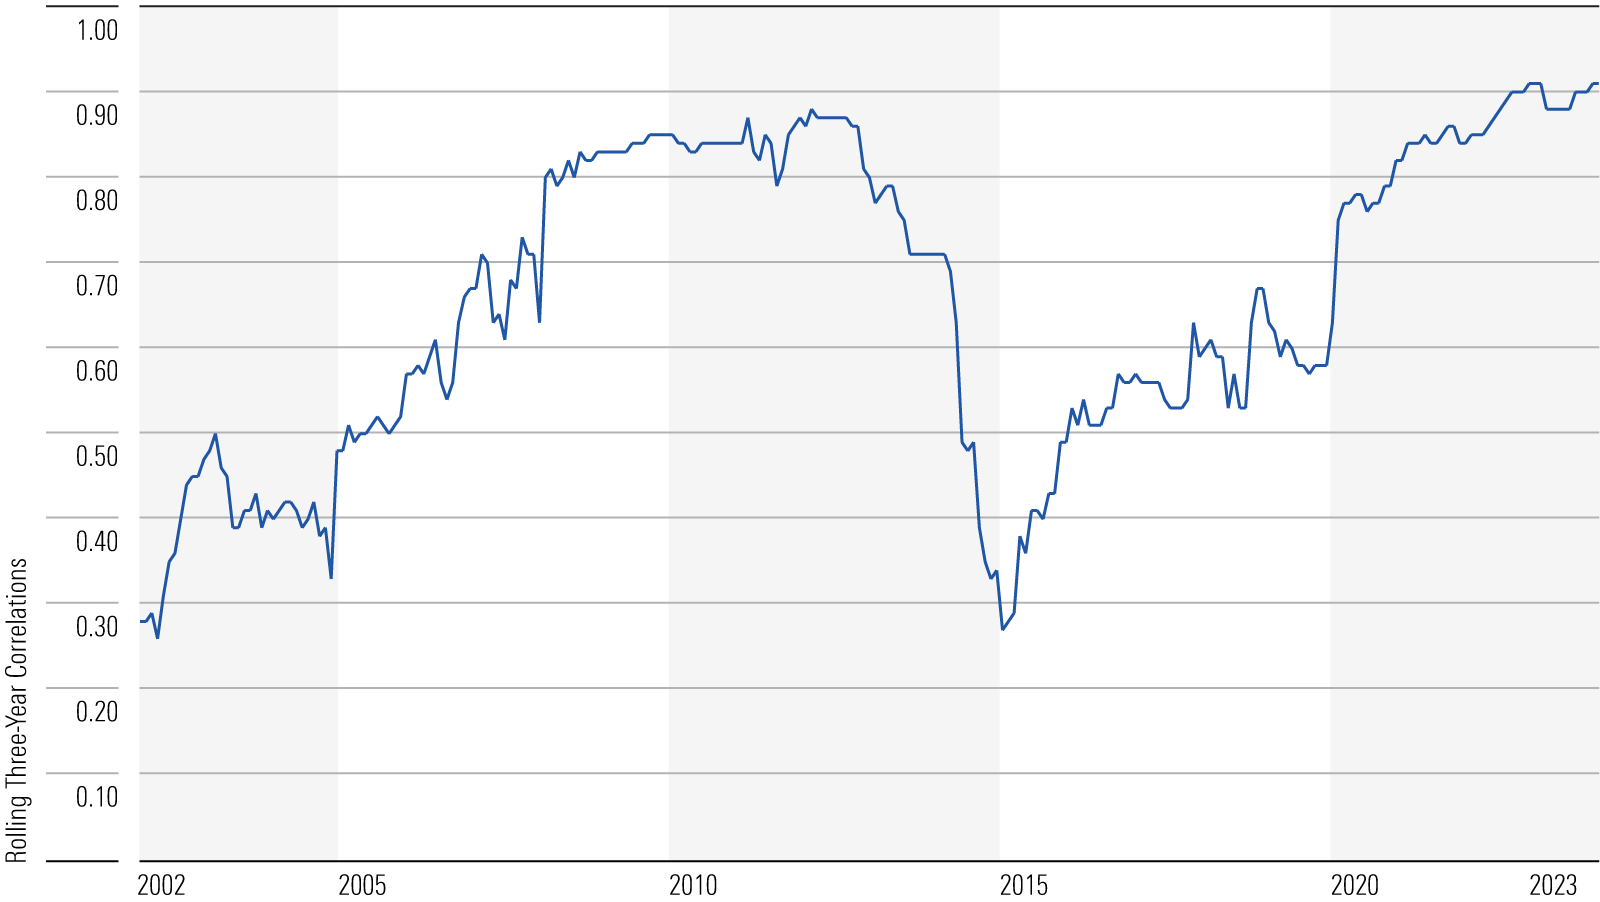
3. Real estate is a questionable portfolio diversifier. Some advisors recommend that investors carve out a separate allocation to real estate stocks with an eye toward boosting yield and diversification. However, real estate (as measured by the Morningstar US Real Estate Index) has been an underwhelming diversifier over long-term periods, with correlations typically hovering around 0.70 and more than 0.90 recently.
Rolling Three-Year Correlations vs. Morningstar US Market Index: Morningstar US Real Estate Index
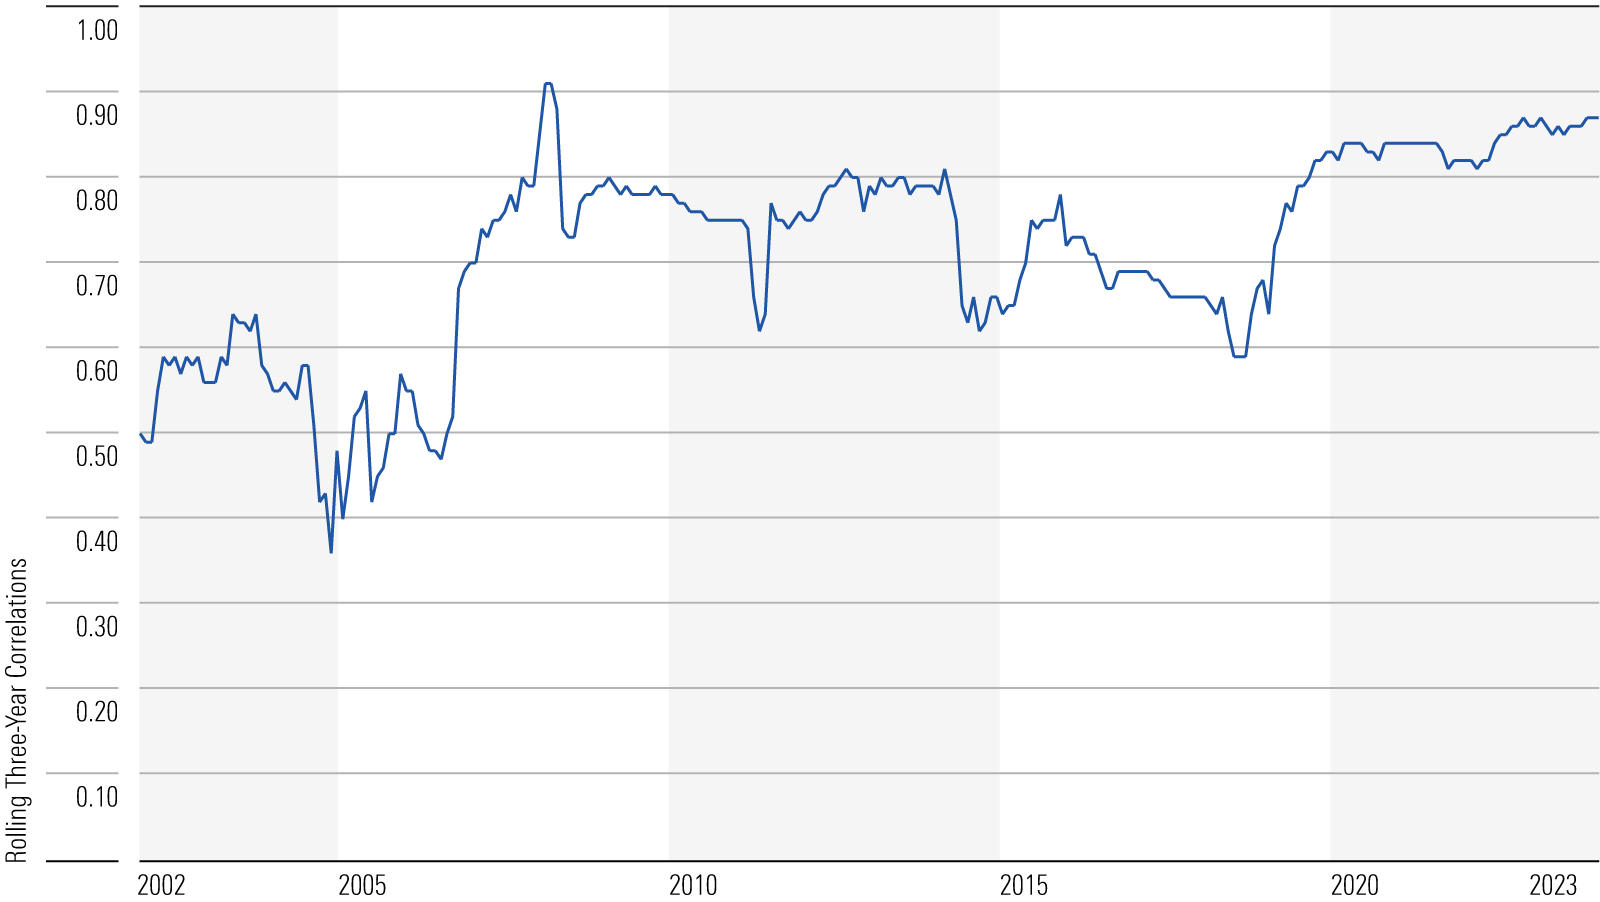
4. High-yield bonds don’t make the best portfolio diversifier, either. Over the past three years, the Morningstar US High-Yield Bond Index has had a correlation of 0.87 with the equity market. Not only do high-yield bonds often move in tandem with stocks, but they’re also much less defensive than other bonds and more sensitive to economic stress.
Rolling Three-Year Correlations vs. Morningstar US Market Index: Morningstar US High-Yield Bond Index
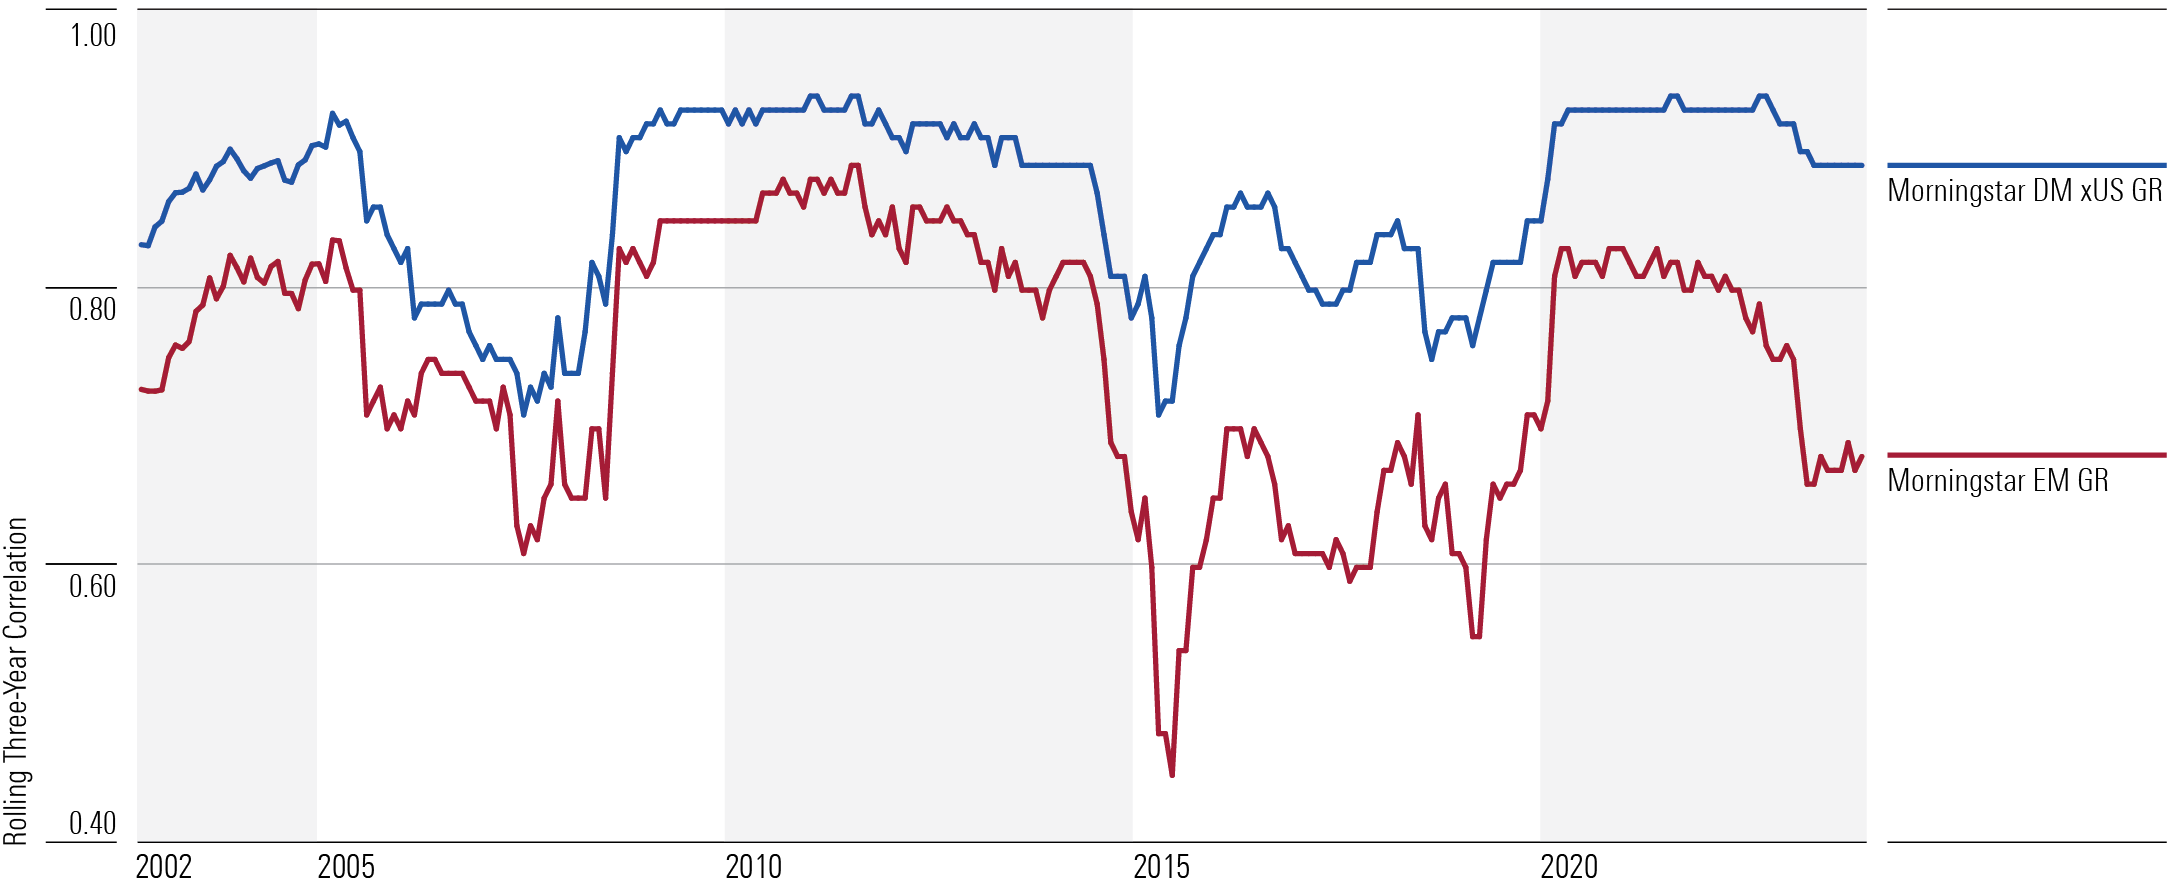
5. International stocks from developed markets have provided modest diversification benefits in recent years. From a diversification perspective, most international stock benchmarks, especially those in developed markets, have been closely tied to the US market over the past three years, as shown in the chart below. Developed-markets equities, especially European stocks, have had the tightest correlation with US equities. Meanwhile, emerging-markets stocks have tended to have lower correlations with US stocks, and those correlations have generally trended down since 2000.
Rolling Three-Year Correlations vs. Morningstar US Market Index: International Equity
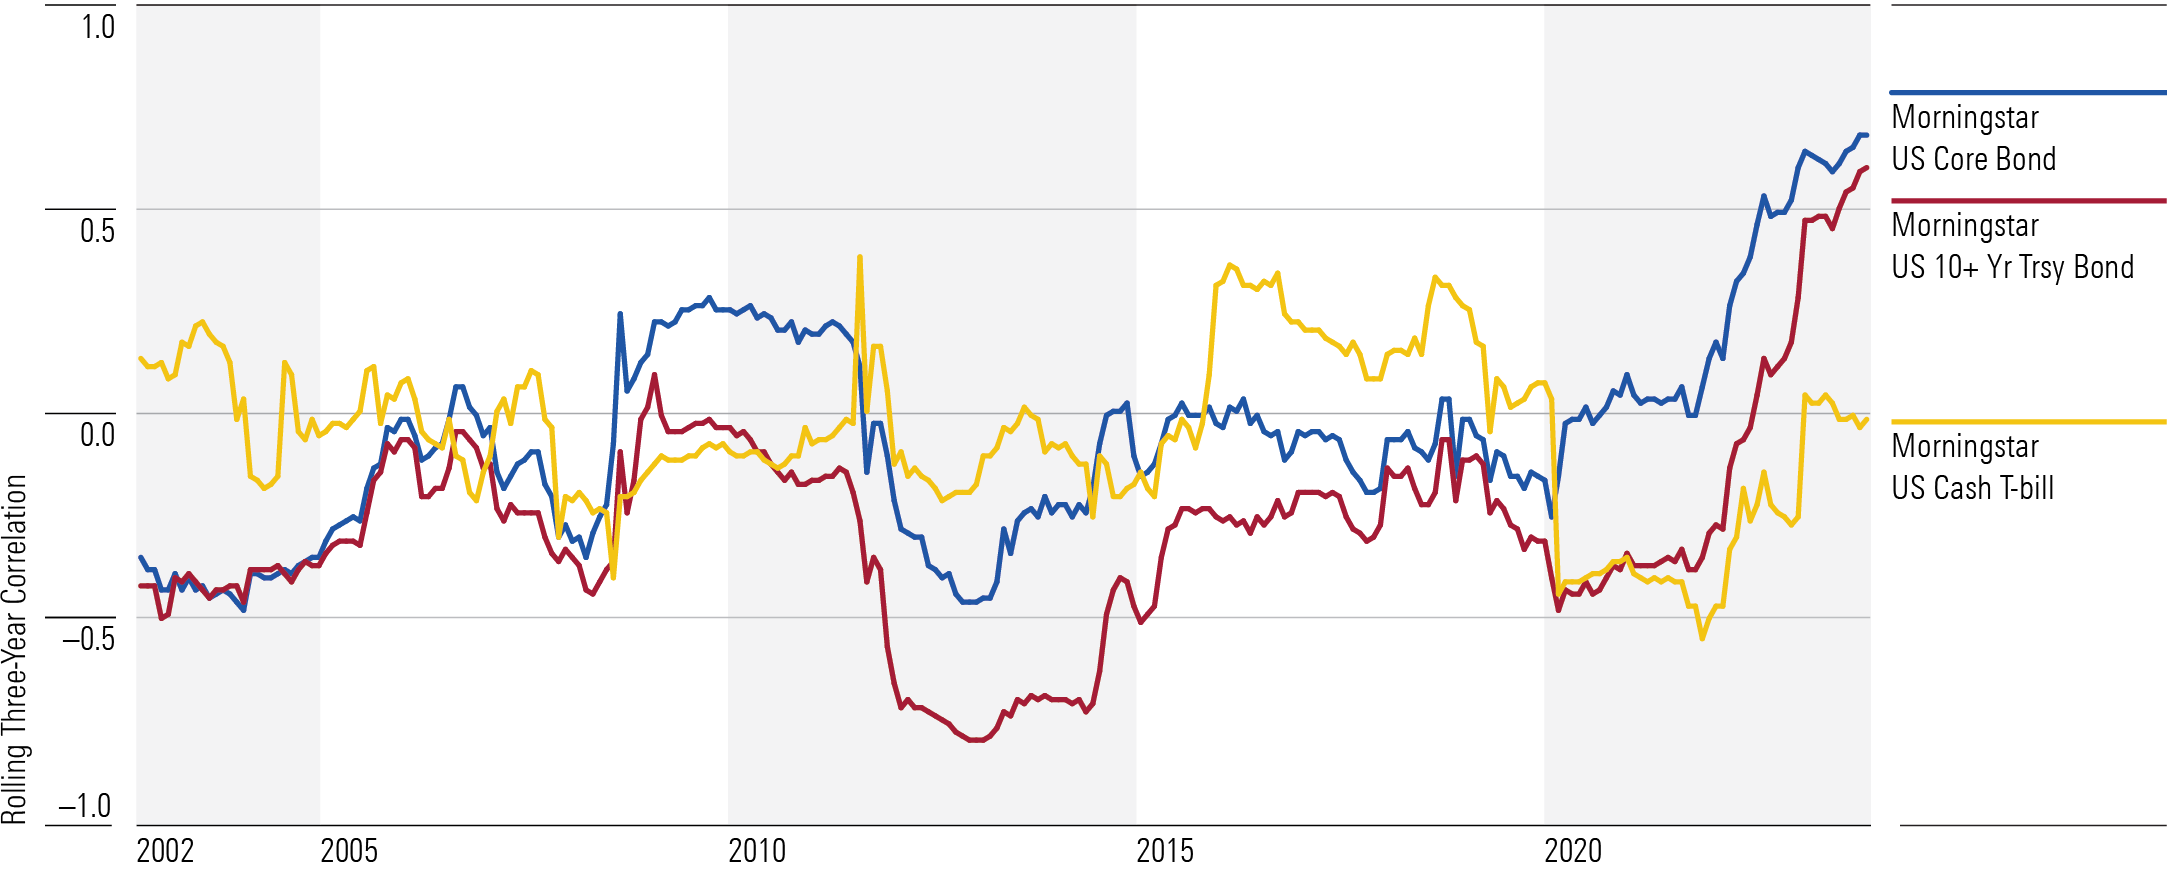
6. Cash has been a surprisingly good portfolio diversifier. Cash has recently looked significantly better than Treasuries from the standpoint of diversification, especially as interest rates have trended up. While cash doesn’t build long-term wealth, the improving diversification benefit from cash underscores its merit as a store of value for investors with short-term liquidity needs.
Rolling Three-Year Correlations vs. Morningstar US Market Index: Taxable Bonds
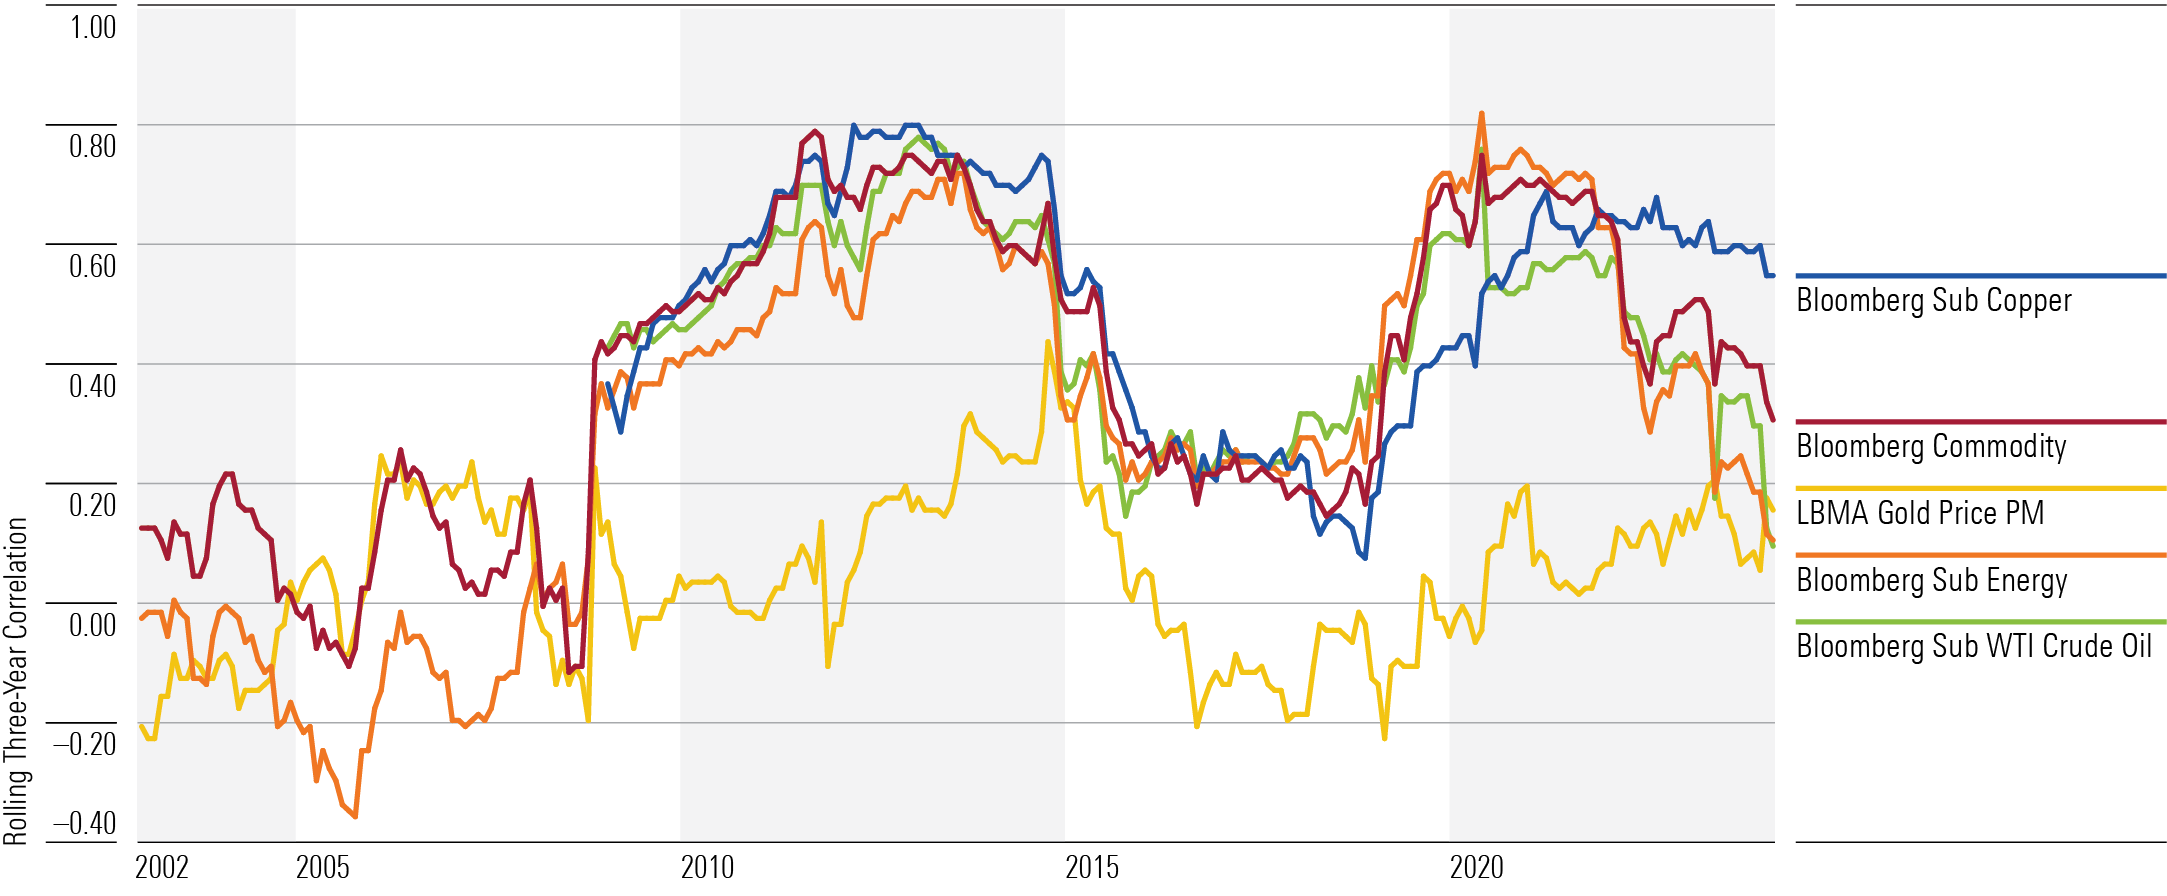
7. Commodities (including gold) can provide compelling diversification benefits, although performance has often been weak. In contrast to correlation trends for most other asset classes, correlations for commodities have generally trended down in recent years. However, the wide range of returns for various commodities in any given year makes them difficult to use effectively in a portfolio.
Rolling Three-Year Correlations vs. Morningstar US Market Index: Commodities
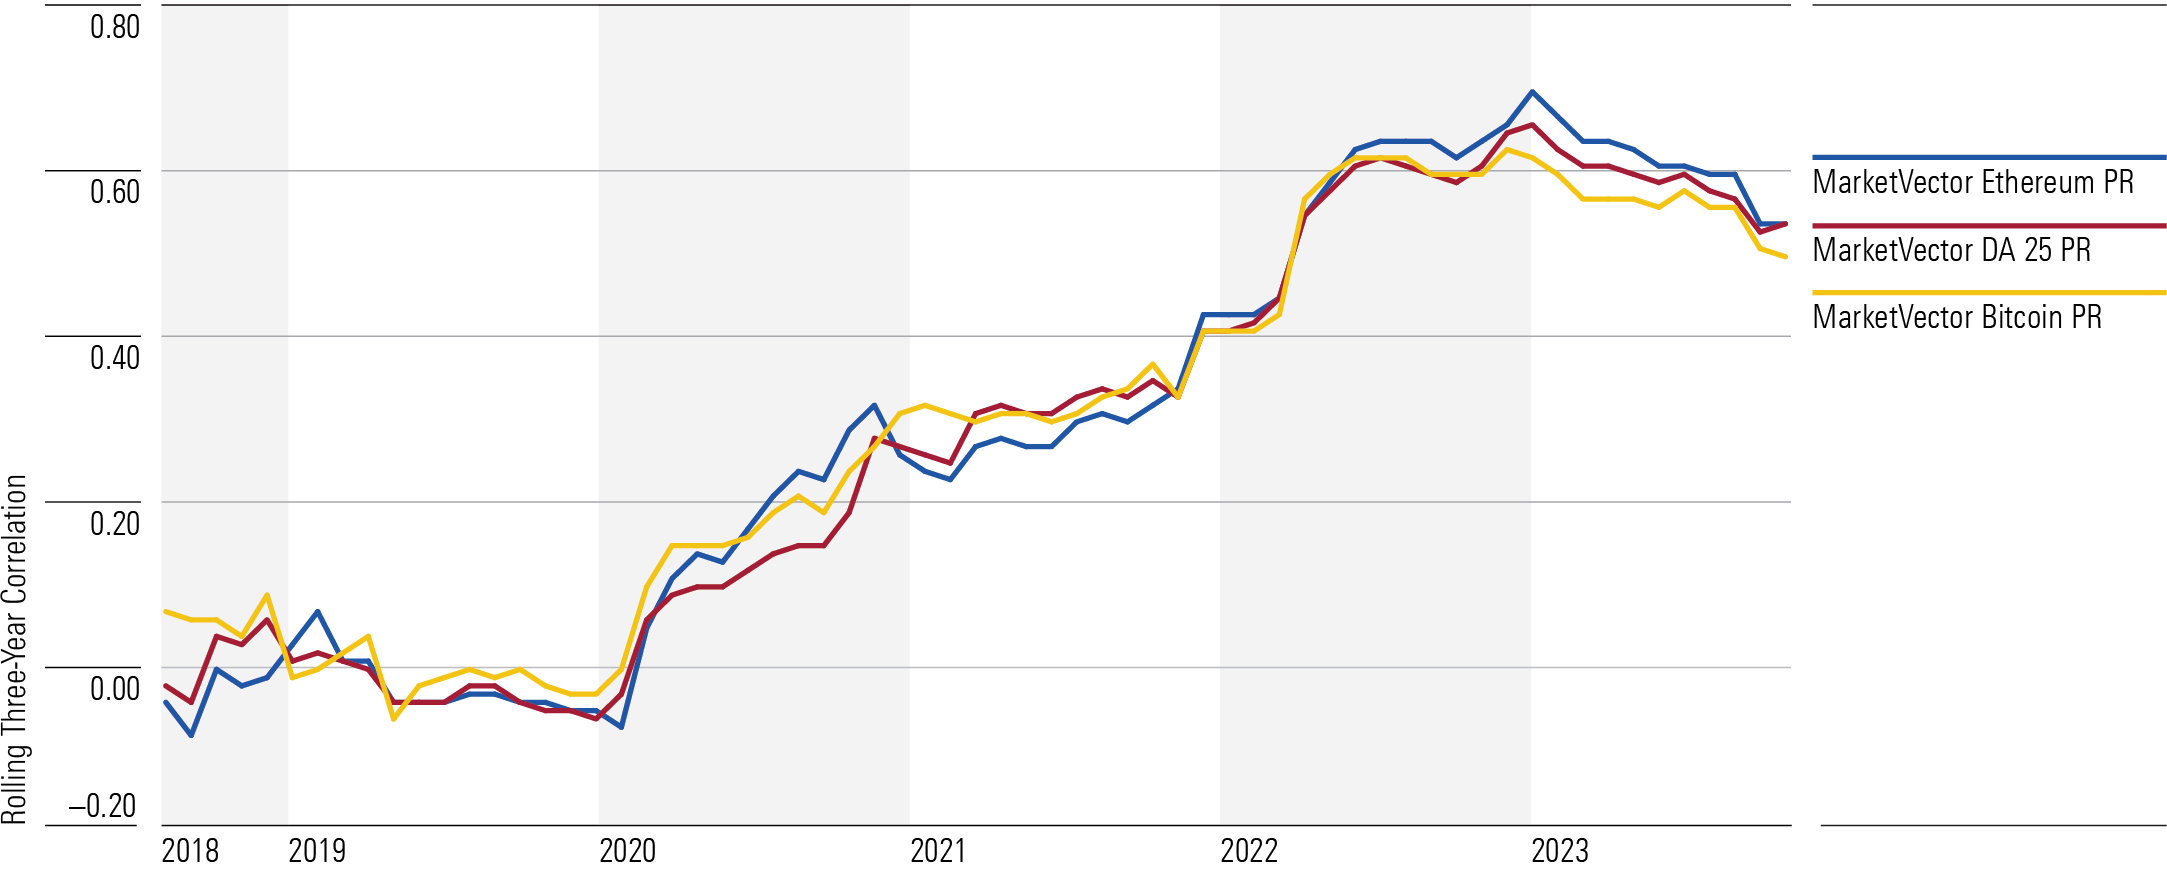
8. Cryptocurrency is often viewed as a noncorrelated asset, but its correlation with stocks has significantly increased in recent years. In addition, its extreme volatility makes it difficult to live with for most investors.
Rolling Three-Year Correlations vs. Morningstar US Market Index: Cryptocurrency
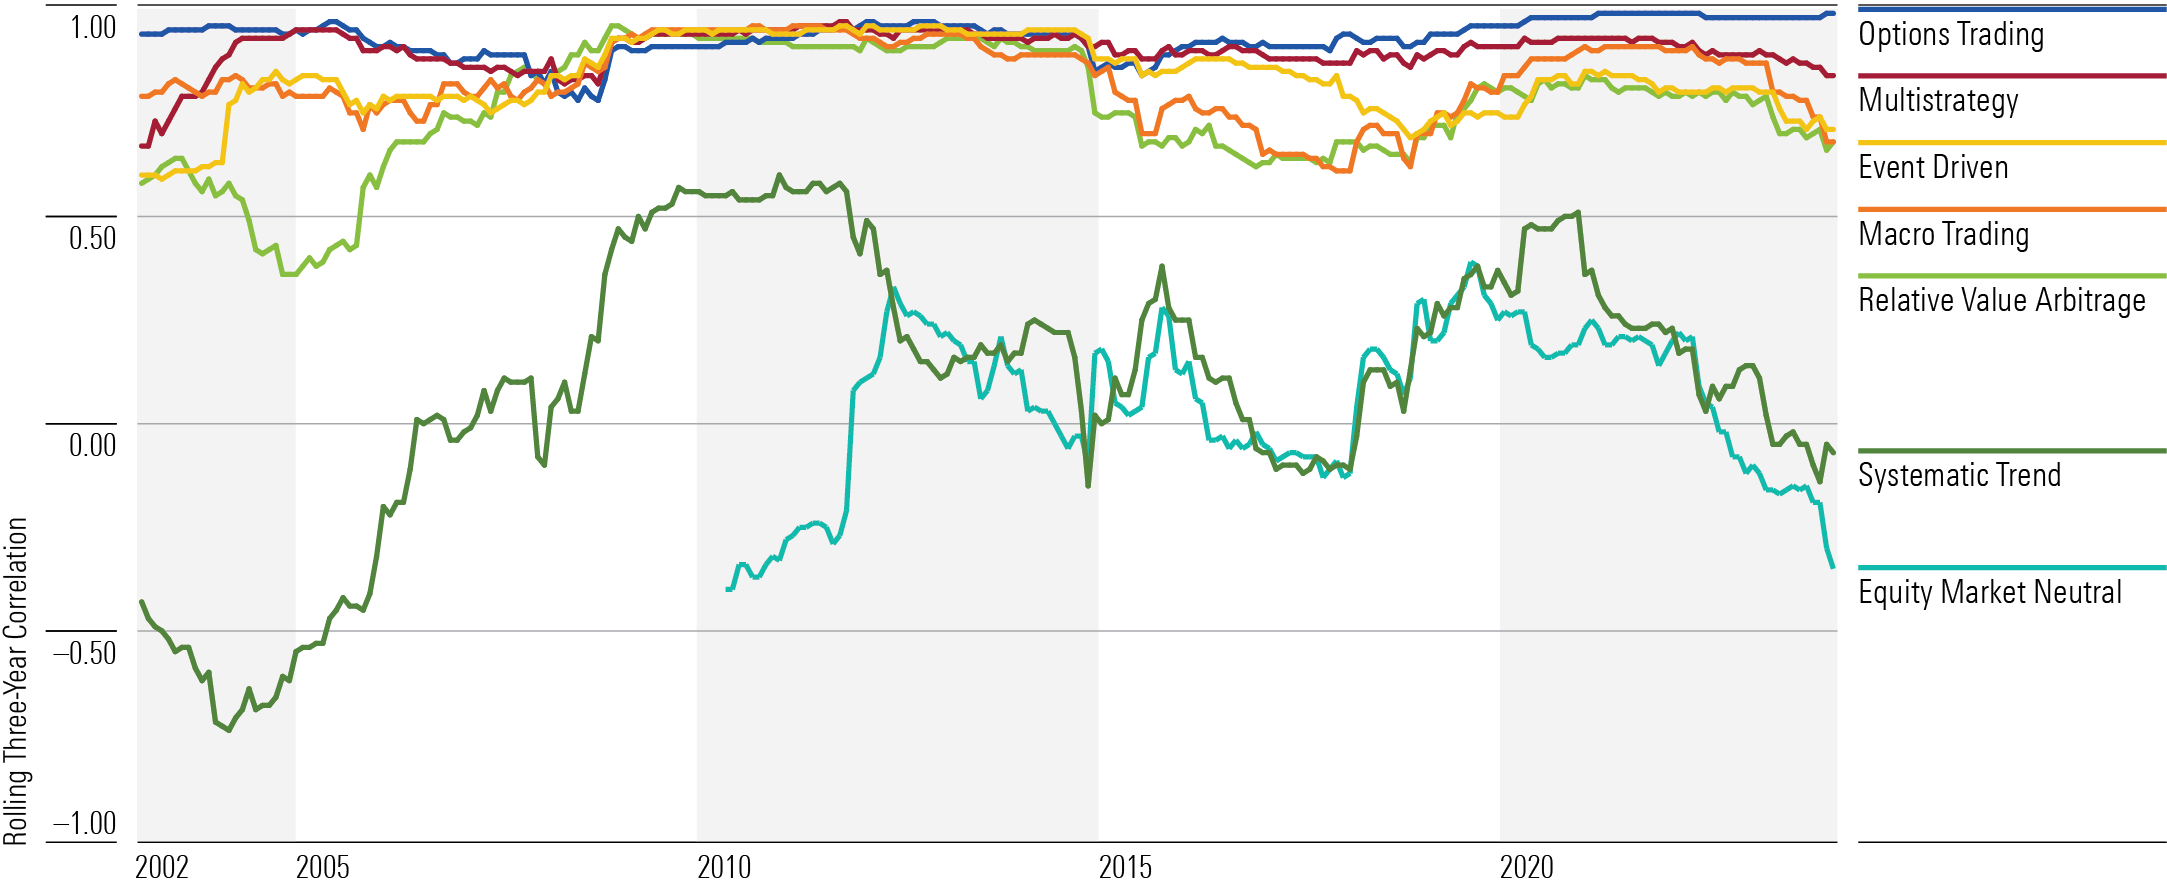
9. When it comes to diversification, not all liquid alternatives are created equal. Alternative strategies, as the name suggests, offer something fundamentally different from mainstream asset classes. Morningstar defines these strategies based on their ability to modify, diversify, or eliminate traditional market risks. There is considerable variation between strategies, though. Equity market-neutral and systematic-trend funds typically have little to no sensitivity to moves in equity markets, but other strategies are more closely linked to stocks.
Rolling Three-Year Correlations vs. Morningstar US Market Index: Alternatives
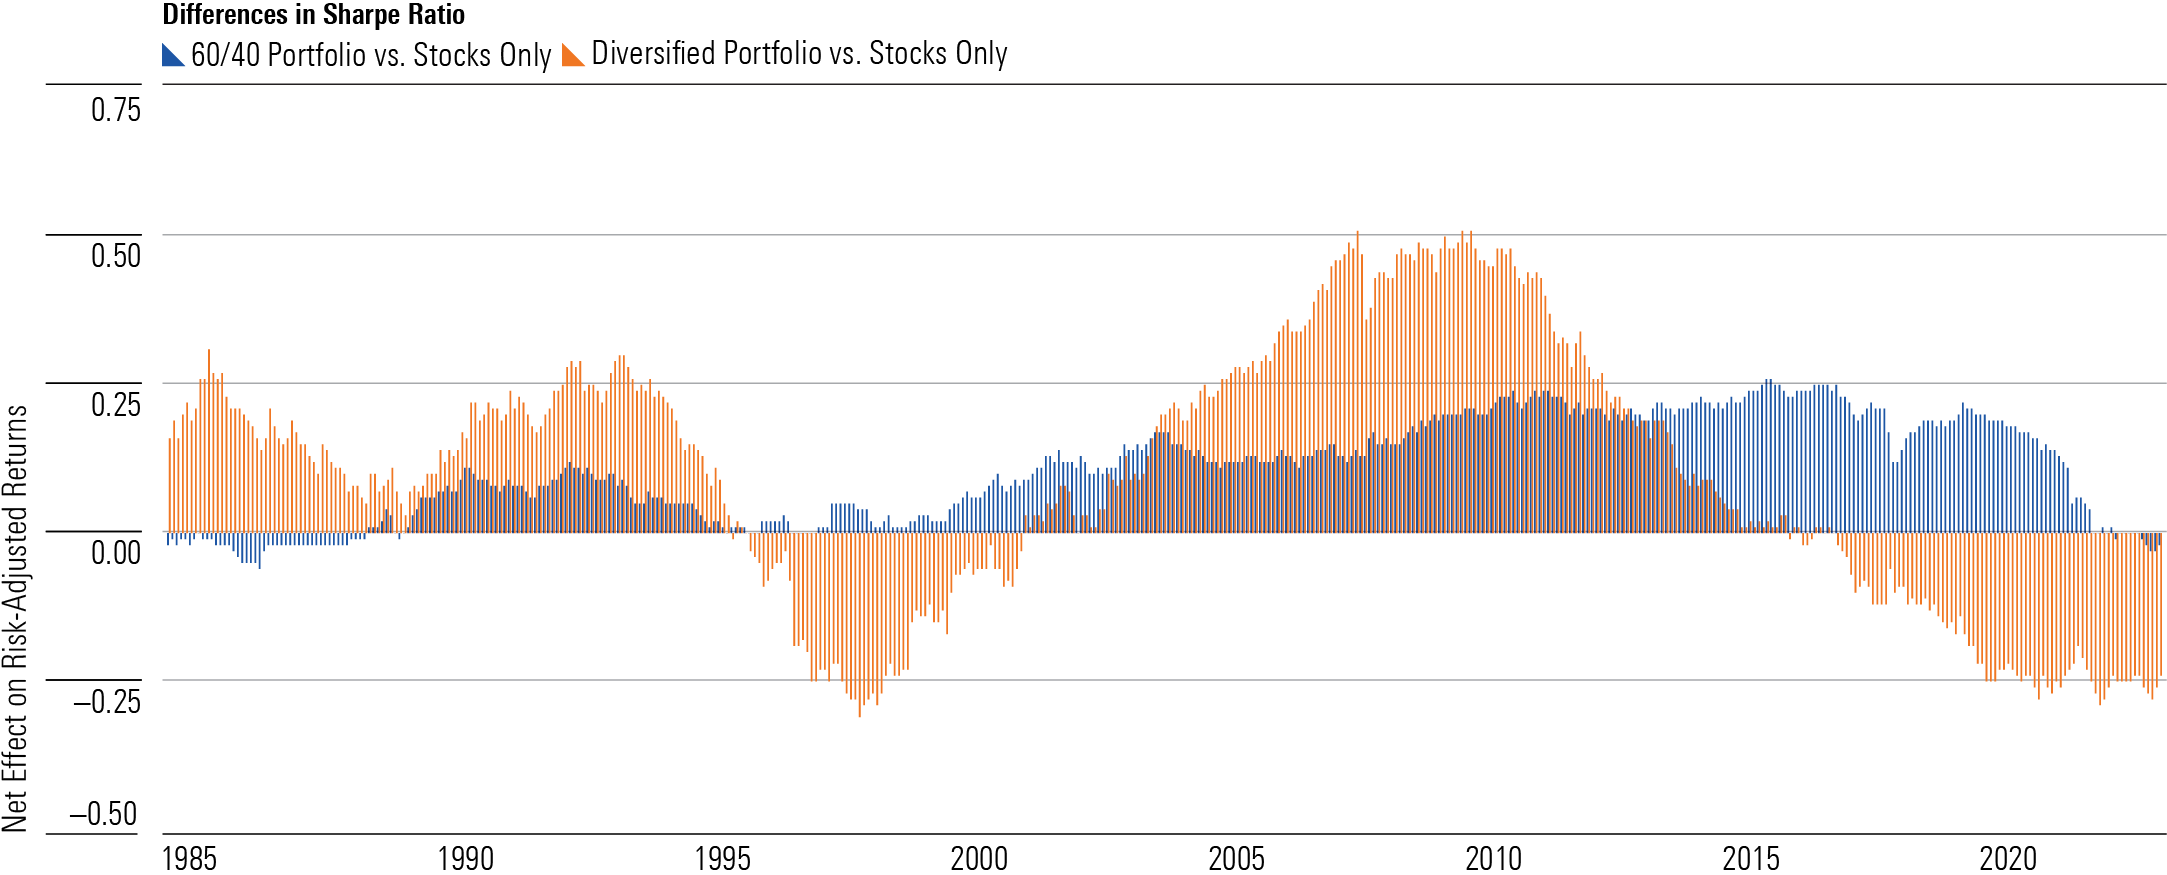
10. Portfolio diversification doesn’t have to be complicated. I set up two different test portfolios: one with a basic mix of 60% US stocks and 40% investment-grade bonds, and the other with 11 different asset classes, including a 20% stake in larger-cap domestic stocks; 10% each in developed- and emerging-markets stocks, Treasuries, US core bonds, global bonds, and high-yield bonds; and 5% each in small-cap stocks, commodities, gold, and REITs. The more diversified portfolio has occasionally outperformed, but the basic 60/40 mix had better risk-adjusted returns in about 87% of the rolling 10-year periods starting in 1976. The upshot: Investors looking to build diversified portfolios don’t necessarily need to venture too far beyond a basic mix of larger-cap stocks and high-quality bonds.
Net Effect on Risk-Adjusted Returns
Correction: (March 22, 2024): This article has been updated to replace the first exhibit, which included some 2023 data that was incorrectly color-coded.
The author or authors do not own shares in any securities mentioned in this article. Find out about Morningstar’s editorial policies.

/s3.amazonaws.com/arc-authors/morningstar/360a595b-3706-41f3-862d-b9d4d069160e.jpg)
/cloudfront-us-east-1.images.arcpublishing.com/morningstar/6ZMXY4RCRNEADPDWYQVTTWALWM.jpg)
/cloudfront-us-east-1.images.arcpublishing.com/morningstar/URSWZ2VN4JCXXALUUYEFYMOBIE.png)
/cloudfront-us-east-1.images.arcpublishing.com/morningstar/CGEMAKSOGVCKBCSH32YM7X5FWI.png)
:quality(80)/s3.amazonaws.com/arc-authors/morningstar/360a595b-3706-41f3-862d-b9d4d069160e.jpg)