
12 Must-See Charts for Investors in September 2023
The charts and themes that tell the current story in markets and investing.

Nothing Drives Sentiment Like Prices
Markets love to fool the masses. The Federal Reserve’s first rate hike of this cycle happened on March 16, 2022. Ten more rate hikes followed over the next 16 months—one of the most aggressive Fed hiking cycles ever.
What have U.S. stocks done since that first hike? They’re positive, up more than 5%.
U.S Large-Cap Stocks Since First Rate Hike
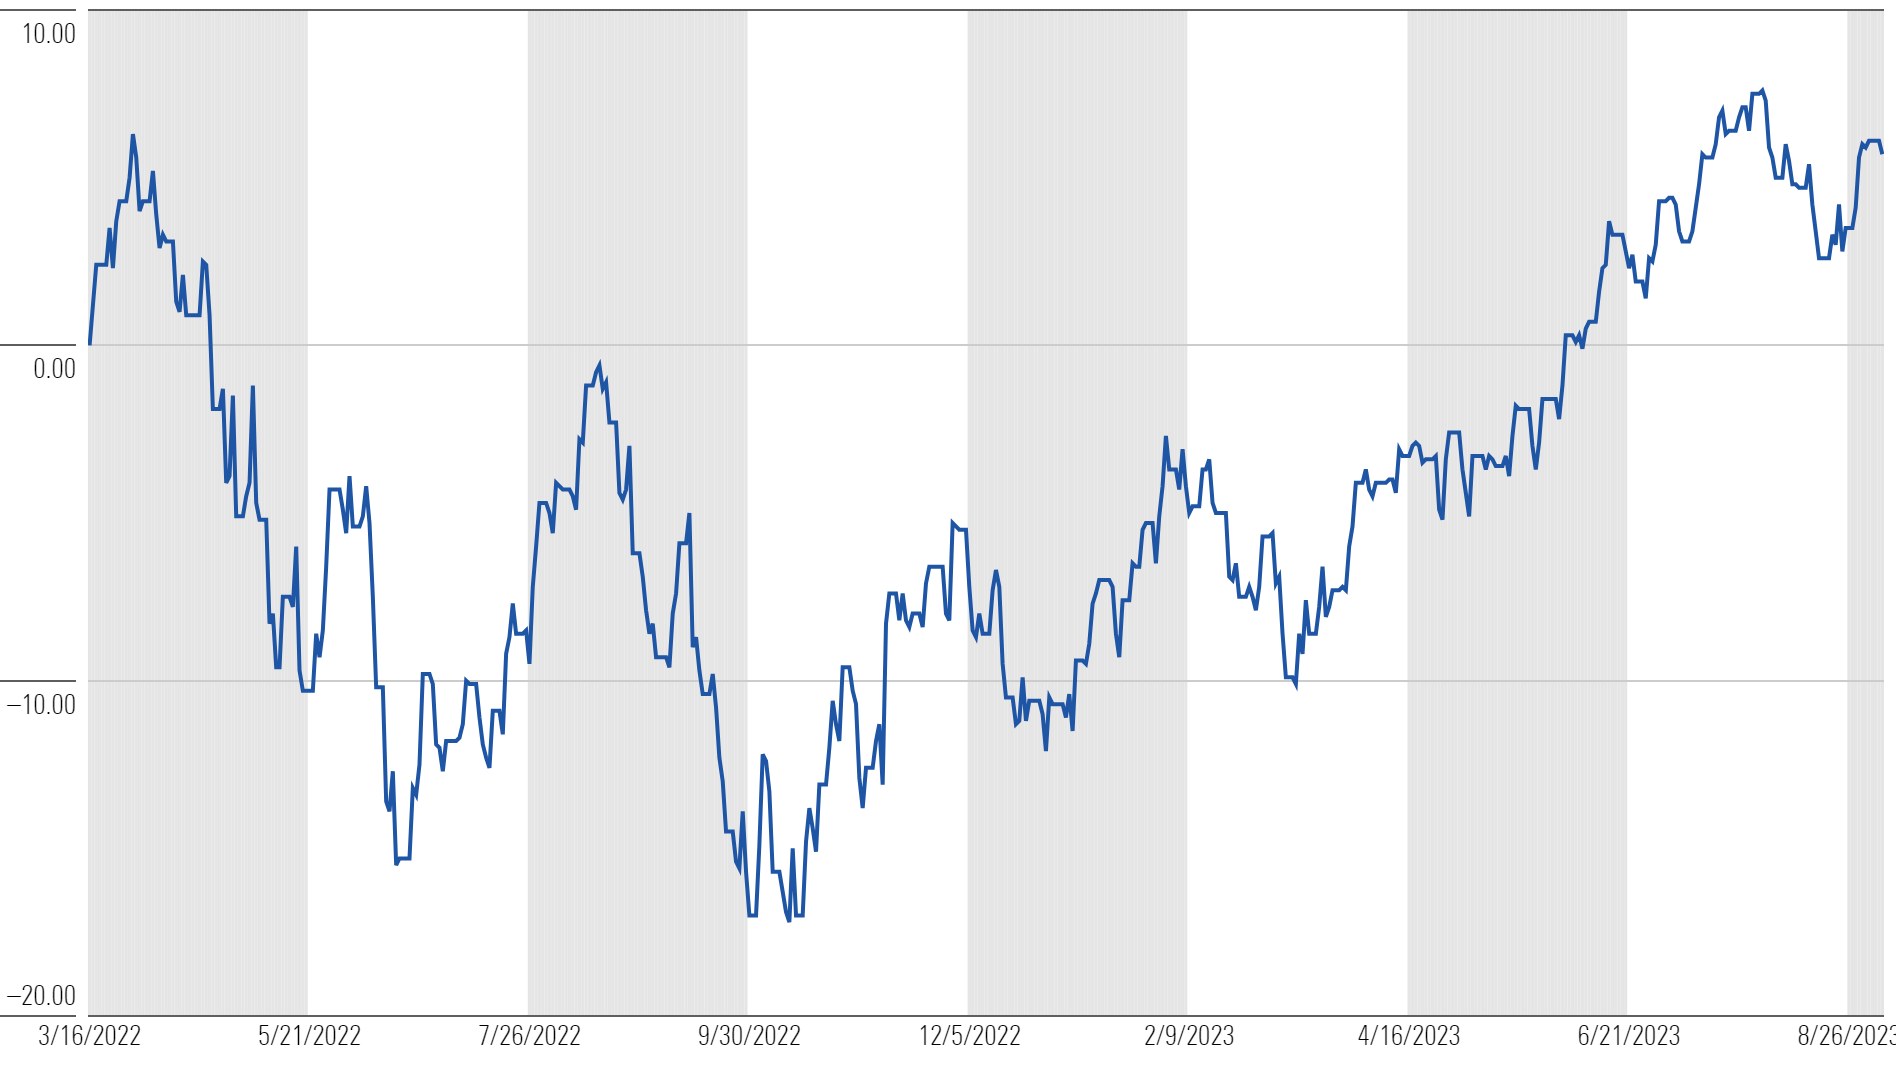
Consider all that happened between March 2022 and now: 40-year highs in inflation, an earnings recession, and 30-year mortgage rates spiking from 2.50% to 7.50%.
A positive stock market through all that was in nobody’s crystal ball. But now, investors seem to be warming up to stocks again.
Using data from the National Association of Active Investment Managers—which shows the average exposure to U.S. equity markets reported by its members—active equity managers have gone from less than 20% exposure to equities in October (when the market bottomed) to a leveraged equity position, with more than 100% net exposure through the end of July.
Active Manager Equity Exposure vs. U.S. Large-Cap Stocks Price Level
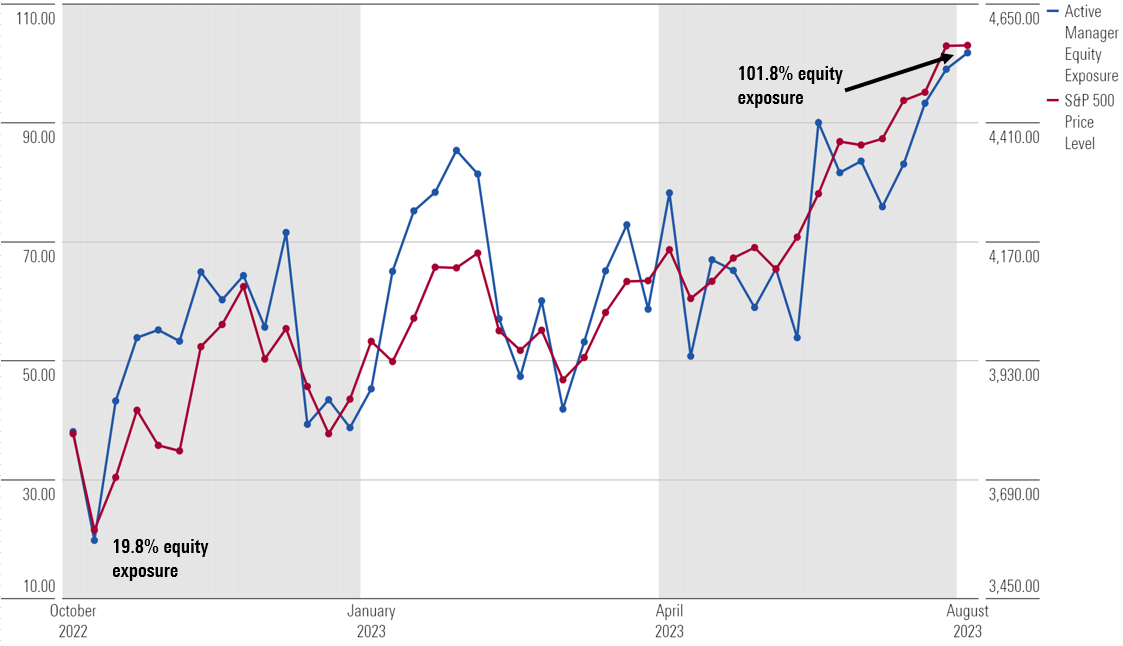
Effectively, many investors liked equities the least when they were on sale, and their attitudes flipped when prices ran up.
There will be more negative periods in the future. And hopefully, this provides helpful context around a key investing principle: It’s not usually turbulent periods that derail compounding; rather, it’s investors’ reaction to them.
Has the Rally Gone Too Far Too Fast?
A common question many advisors are getting from clients is: Do I hold off putting new money in the market and/or possibly derisk my portfolio?
The most practical answer: It’s a matter of perspective. The market is inherently unpredictable over the short term.
For example:
- Since 1970, the S&P 500 has had an annual return of 20% or more 19 different times.
- Eight of those 19 years (42% of the time) saw an intra-year decline of 10% or more.
- 17 of those 19 years (89% of the time) saw an intra-year decline of 5% or more.
U.S. Large Caps: Years With a Return of 20% or More
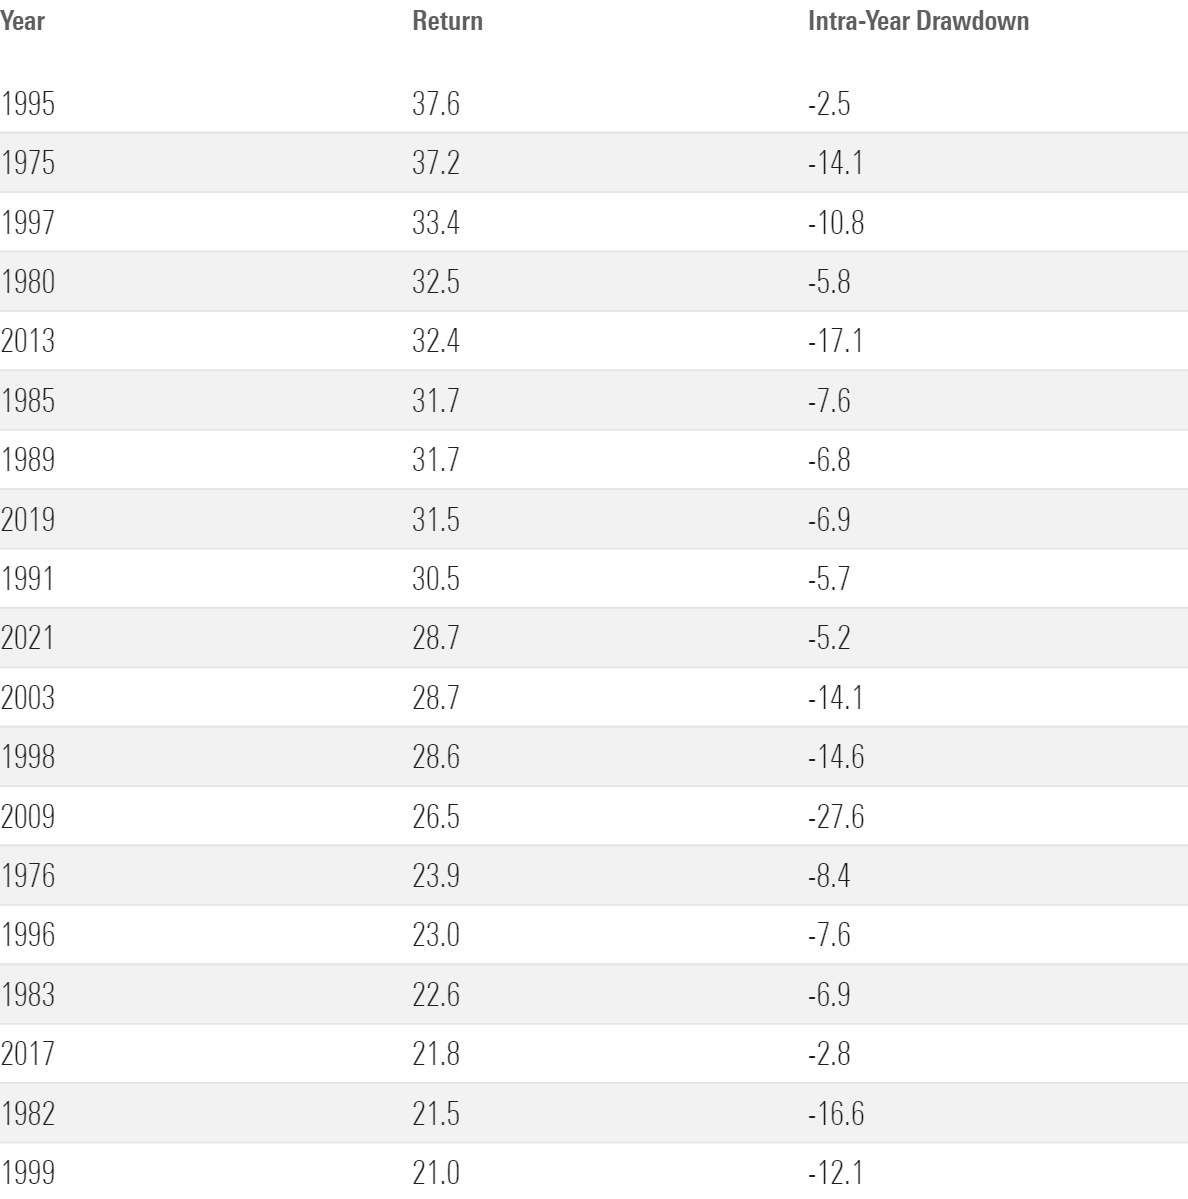
Given that the U.S. market is up around 20% already this year, there’s significant evidence that a market correction—of some variety—could be looming.
The best remedy for moving forward is to be clear with yourself about your investment time horizon. As they say, many investing arguments are just people with different time horizons talking over each other.
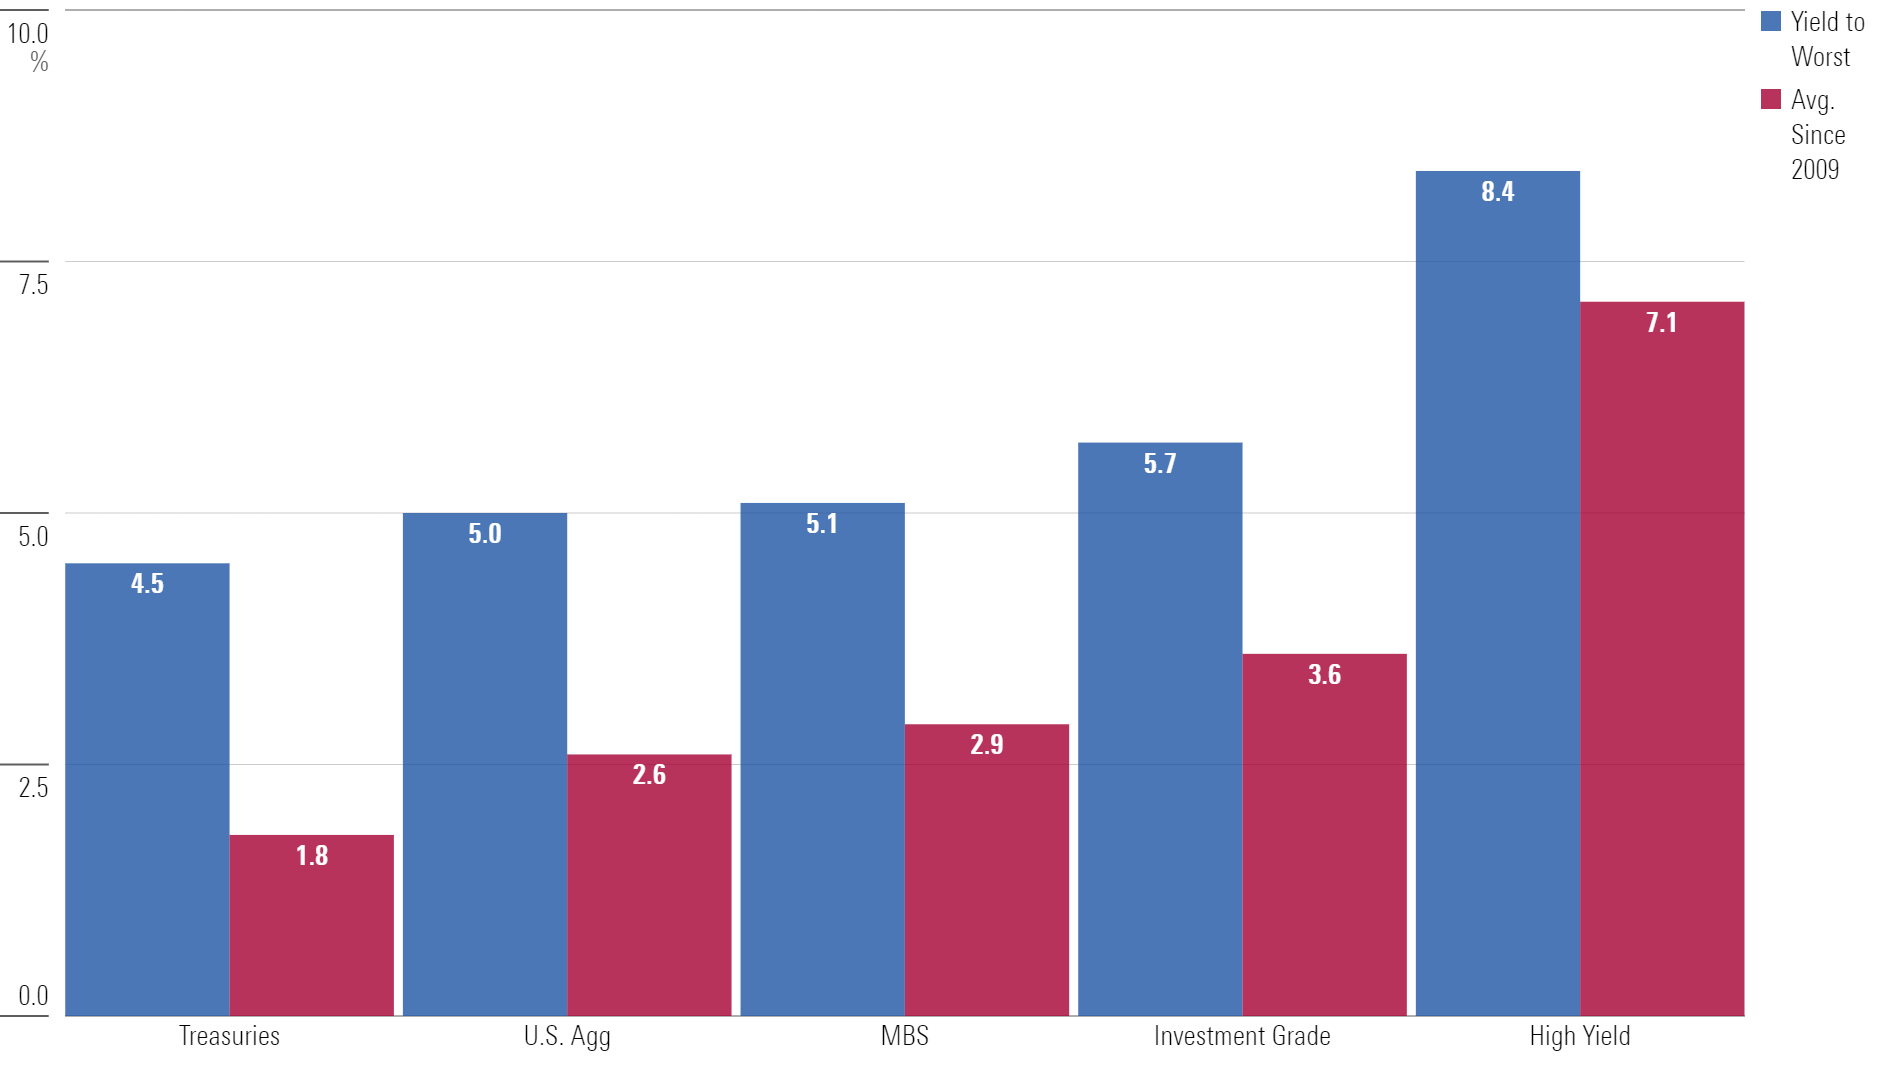
If your time horizon is only a few years, increasing exposure to bonds may warrant a conversation—many parts of the bond market now offer yields that are at their highest levels in over a decade.
Bond Yields vs. Long-Term Average
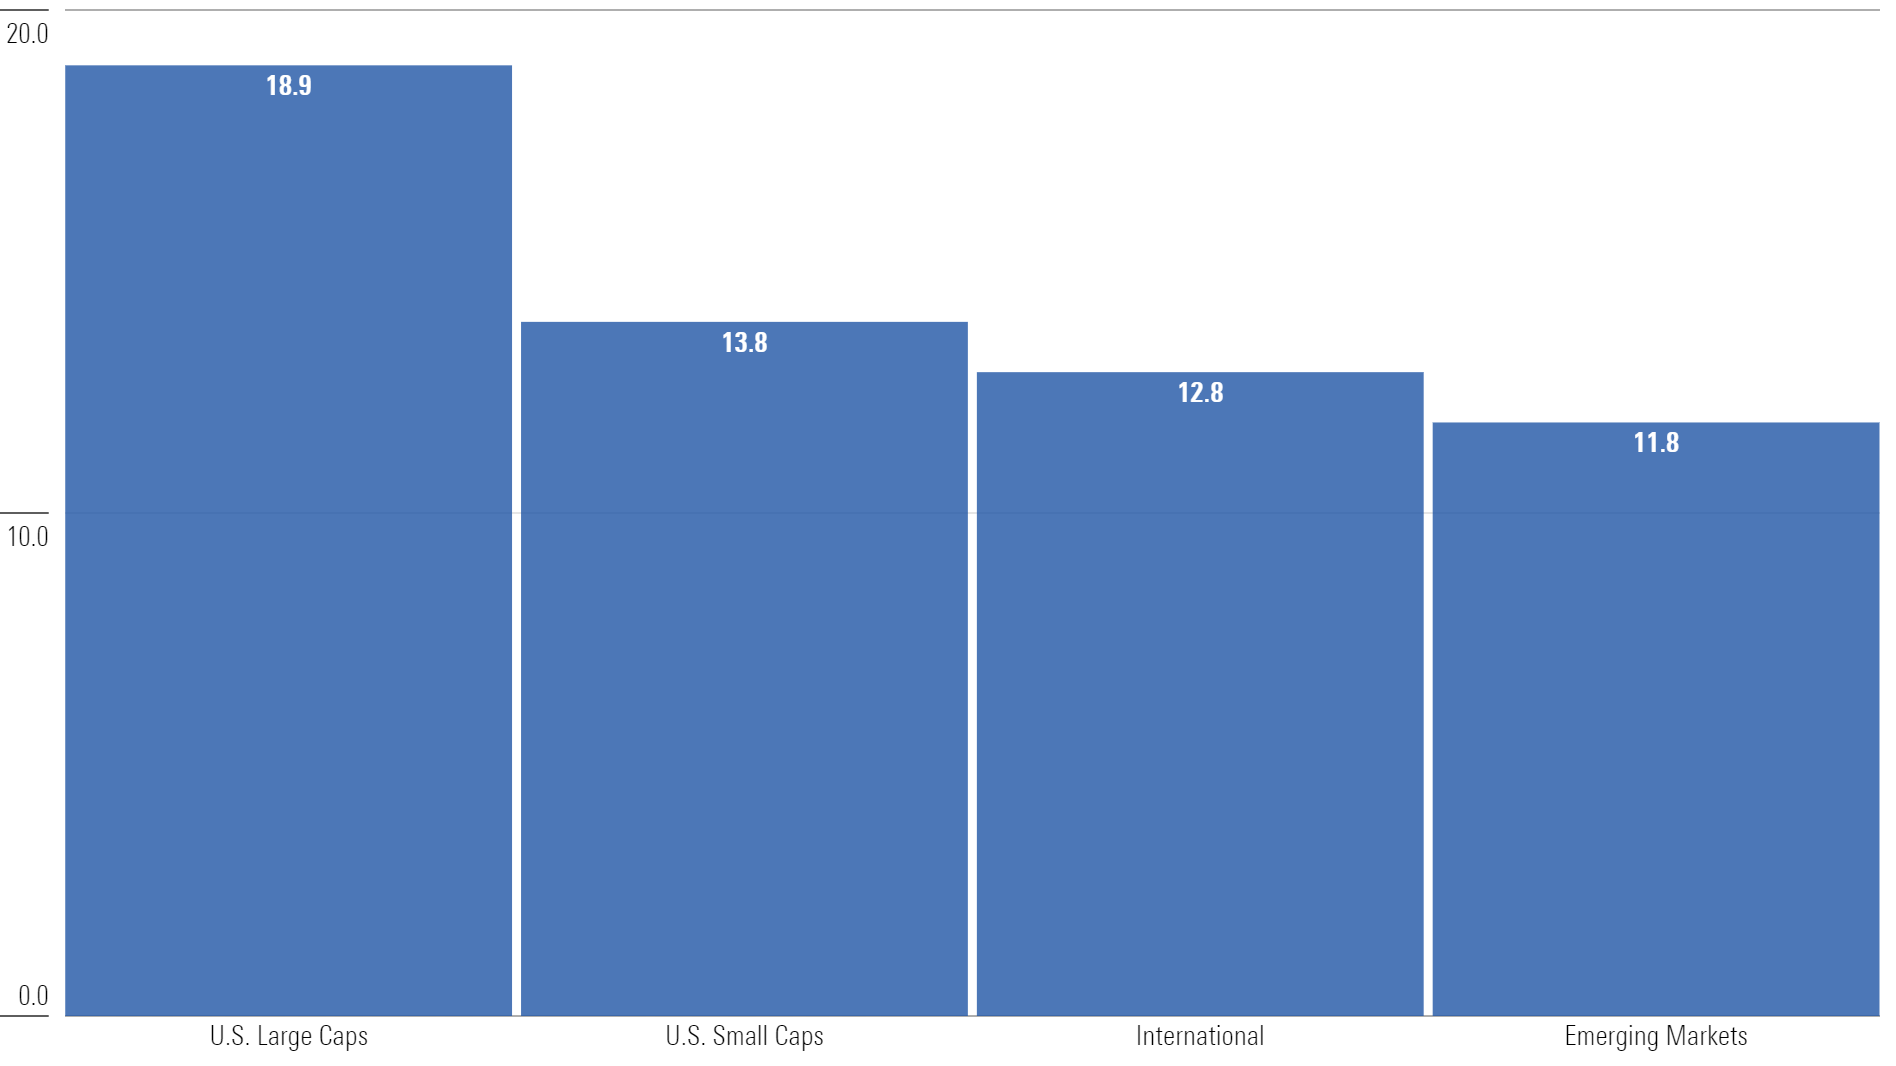
If your time horizon is longer than a few years, but U.S. valuations are of concern, diversifying within equities—away from more expensive U.S. large caps—into U.S. small caps or non-U.S. stocks might be something to consider.
Forward P/E
The Nvidia Effect
Nvidia NVDA has arguably been the stock market’s most important company this year. This is subjective, of course. But artificial intelligence is the theme the world is obsessing over, and Nvidia—and the products it supplies—effectively operates as the pick-and-shovel provider of the AI gold rush.
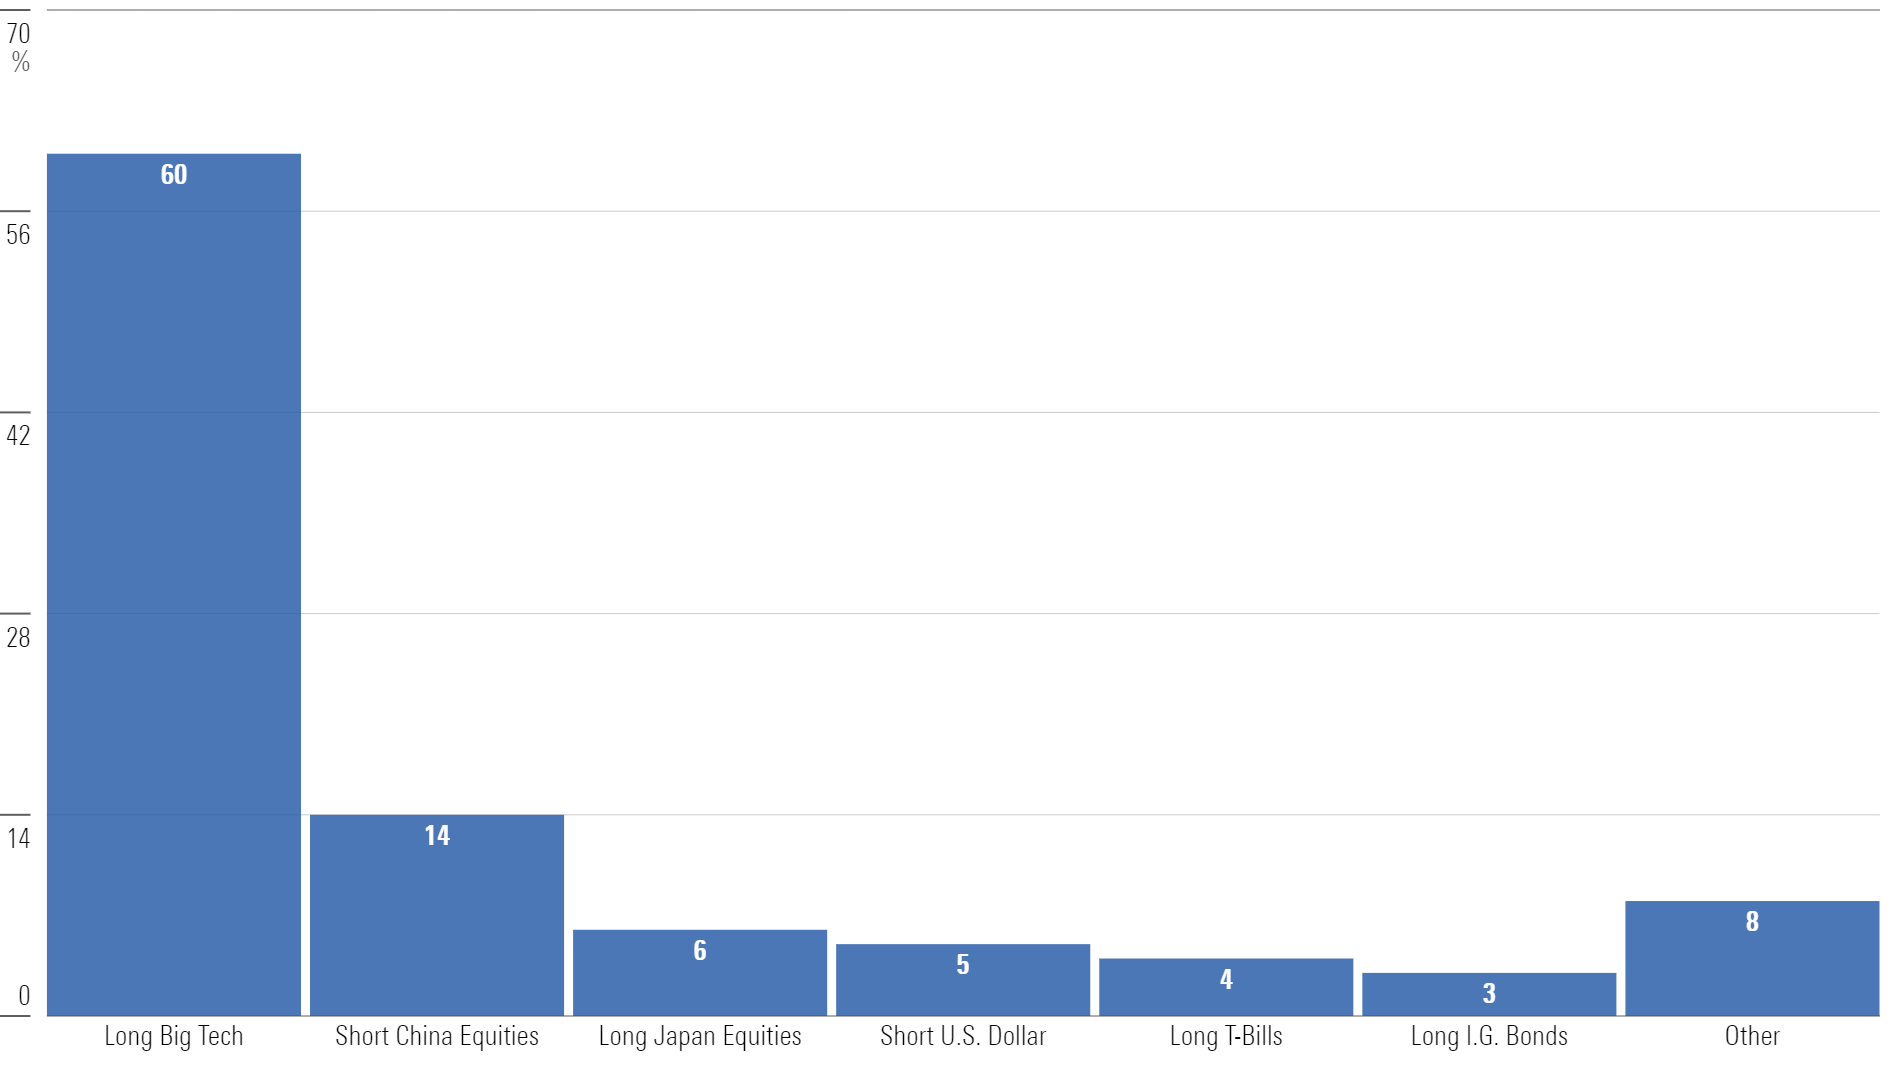
The intersection of technology and AI is one reason Big Tech has become the most crowded trade in the market—and has been for five consecutive months—per data from the Bank of America fund manager survey.
BofA Fund Manager Survey: What do you think is currently the most crowded trade in the market?
But investing constantly requires asking yourself, “How much optimism is in the price?”
In Nvidia’s case, quite a bit.
A recent report from University of Pennsylvania finance professor Jeremy Siegel and WisdomTree looked at Nvidia’s current valuation in the context of history.
Nvidia trades at a 25 times price/sales ratio, the highest valuation in the S&P 500. Given that starting point, what are the odds it outperforms the S&P 500 on a go-forward basis?
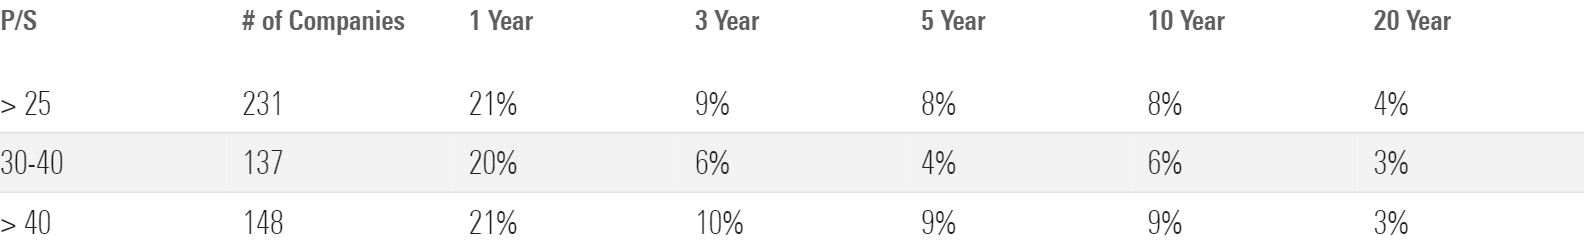
The report found:
- Only 231 other companies breached the 25 times or higher P/S ratio over the past 50 years.
- Only 21% of those 231 companies went on to beat the market over the next 12 months.
- More than 90% of those companies failed to beat the market over the next three-, five-, 10-, and 20-year periods.
Probability That Stocks Outperform the Market at Higher Valuations (% of Time Stock Outperforms)
Nvidia certainly could be one of the small handful of companies that continues to outperform, but the odds are not in its favor.
Comparisons to the tech bubble of the late ‘90s get thrown around often when comparing many of the dominant tech companies we have today. To be fair, there’s probably more differences than similarities today—the most obvious being that today’s companies have a lot more “E” in the P/E ratio than the companies did back then.
But we did see a similar phenomenon play out during the tech bubble. Most of the major companies that dominated the top of the market went on to underperform.
Only one of the 10 most valuable companies at the dot-com peak—Microsoft MSFT—went on to outperform the market in the 20 years following.
Top 10 Tech Companies in 1999
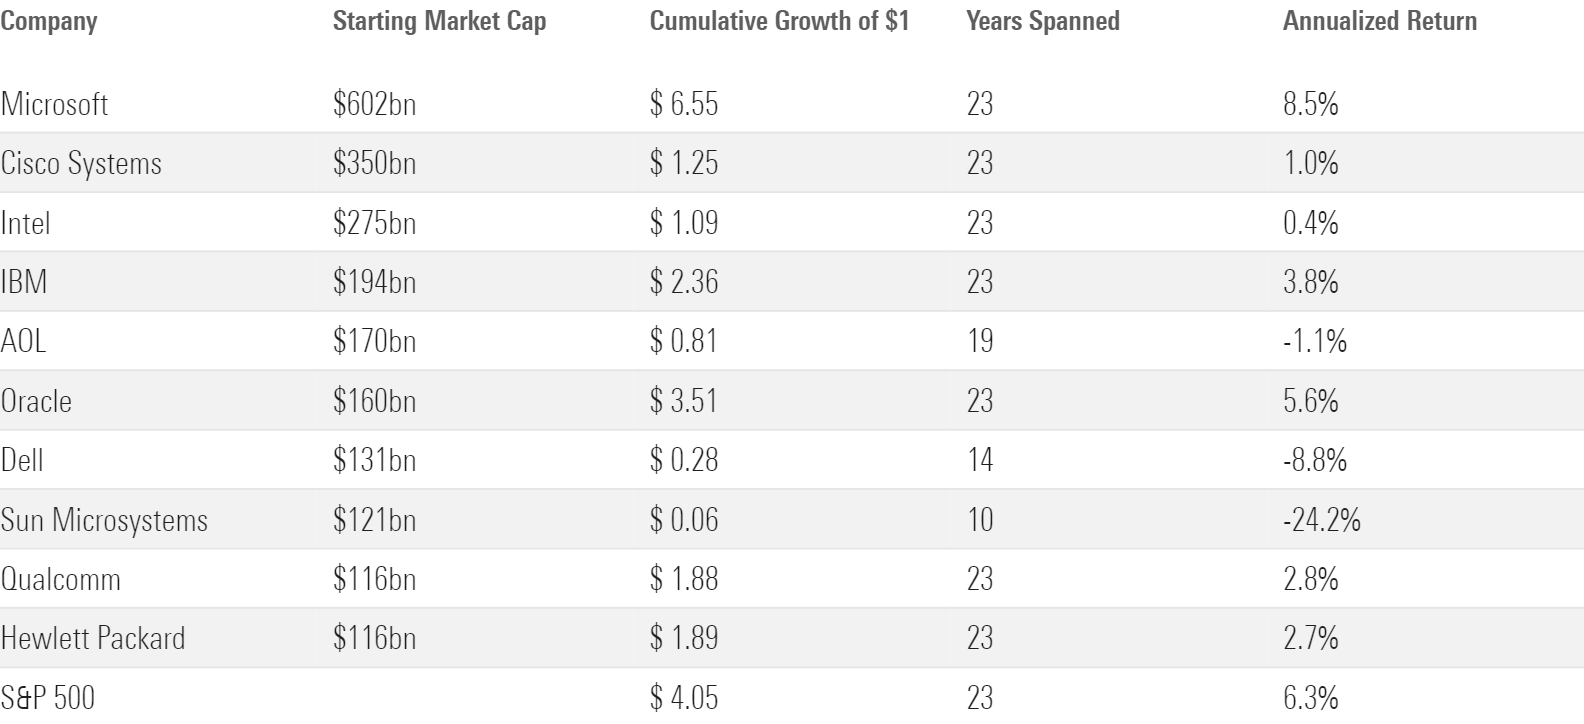
In short, buying into hype has been an expensive mistake more often than not.
IPO Window Opening?
The success of Nvidia has led one peer company to test the waters of going public.
British chip designer Arm Holdings recently filed to go public, targeting a valuation of $50 billion, which is expected to be one of the largest initial public offerings in a few years. Instacart—primarily known for grocery delivery—is also hoping to turn public soon, at a multibillion-dollar valuation.
The IPO market tends to grind to a halt during periods of market turbulence, a reason there were so few of them recently. Nobody wants to bring their company public when markets are depressed, as it likely means the valuation the market would offer them would be depressed as well.
But an improving market has opened the door.
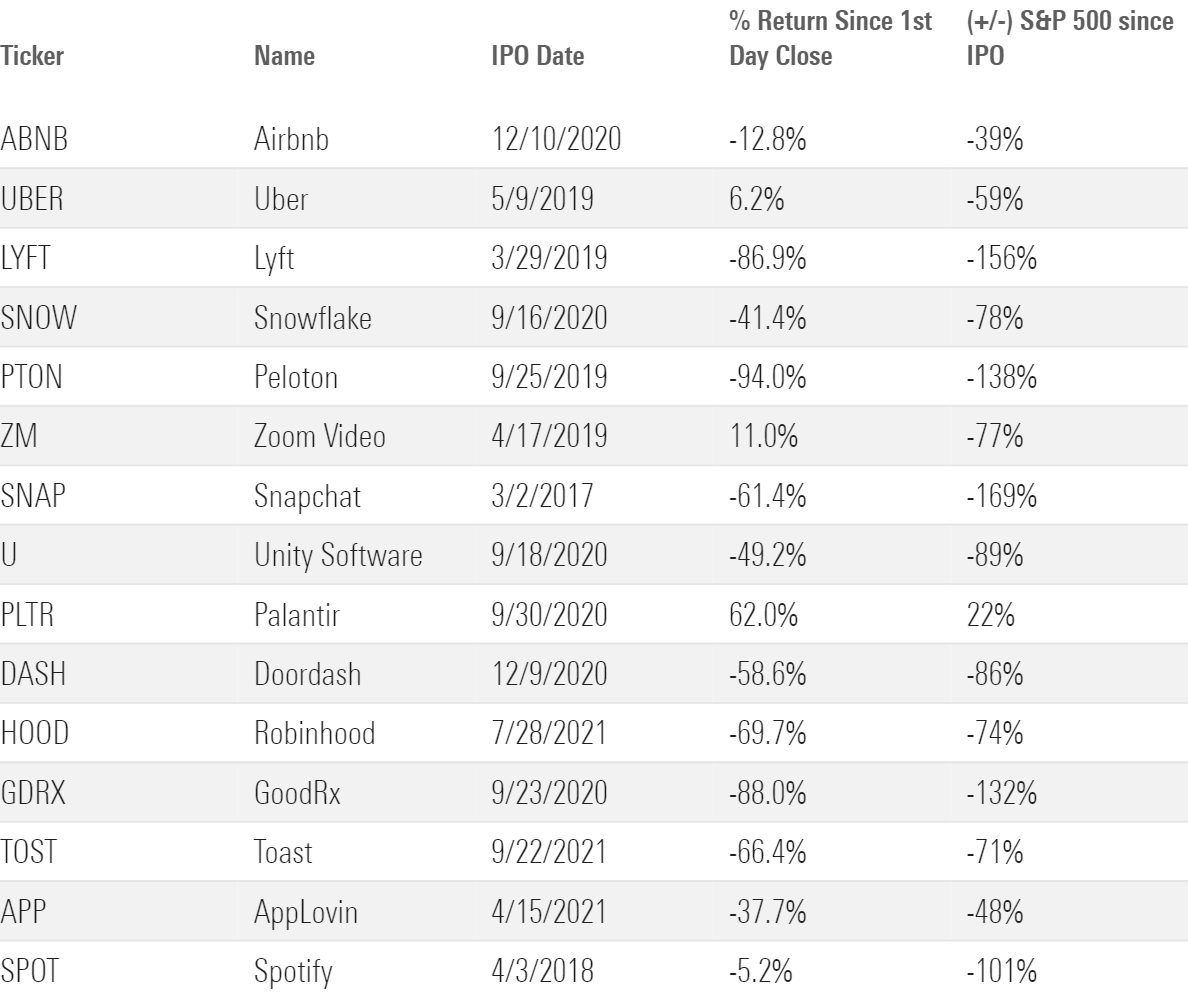
From an investment perspective, the biggest winners in recent large IPOs have been the sellers, not the buyers.
Using a sample of 15 large technology IPOs in recent years, we see results that have not been great. Only three companies—Uber Technologies UBER, Palantir PLTR, and Zoom ZM—have positive market returns since the first-day close of trading. And only one of these companies—Palantir—has outperformed the broader market since going public.
Recent IPO Returns
While 15 companies is interesting anecdotally, it could easily be argued that it lacks the punch of a much larger dataset with a longer track record.
One such dataset—courtesy of Dimensional Fund Advisors—looked at thousands of companies that have gone public since 1992. And the larger dataset reflects much of what is observed above, which is that IPOs as a group tend to underperform the market.
IPO Historical Return Analysis
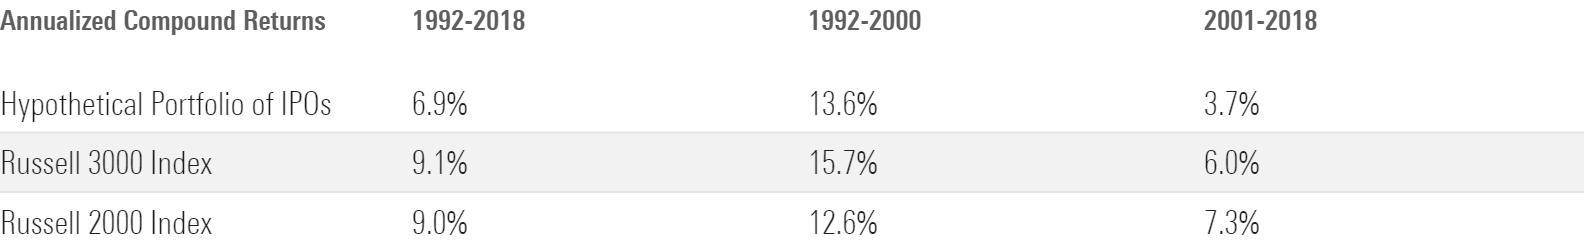
Why do most IPOs underperform? The common theme is tied to the fact that many of these companies are unprofitable and require significant cash investment to fund operations—and the return on the investment has generally not met the market’s initial expectations.
If the IPO window does open in earnest, some amazing companies may become investable for the first time, but investors should approach them with caution.
$1 Trillion in Credit Card Debt
U.S. consumers have eclipsed more than $1 trillion in credit card debt, an all-time record.
Credit Card Debt
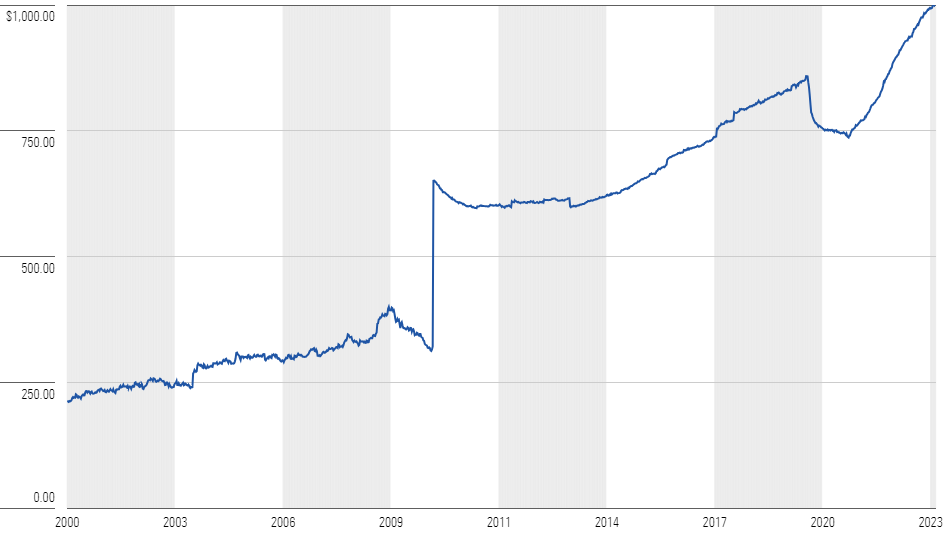
Basic instincts tell us this is a problem—$1 trillion is a big scary number—and the fearmongering has begun.
But there’s more to consider. It’s common to emphasize a numerator when it’s moving higher and focus on that number in isolation. But what if the denominator is moving higher as well?
Focusing on credit card debt in isolation completely ignores the fact that household net worth is also at all-time highs.
Household Net Worth
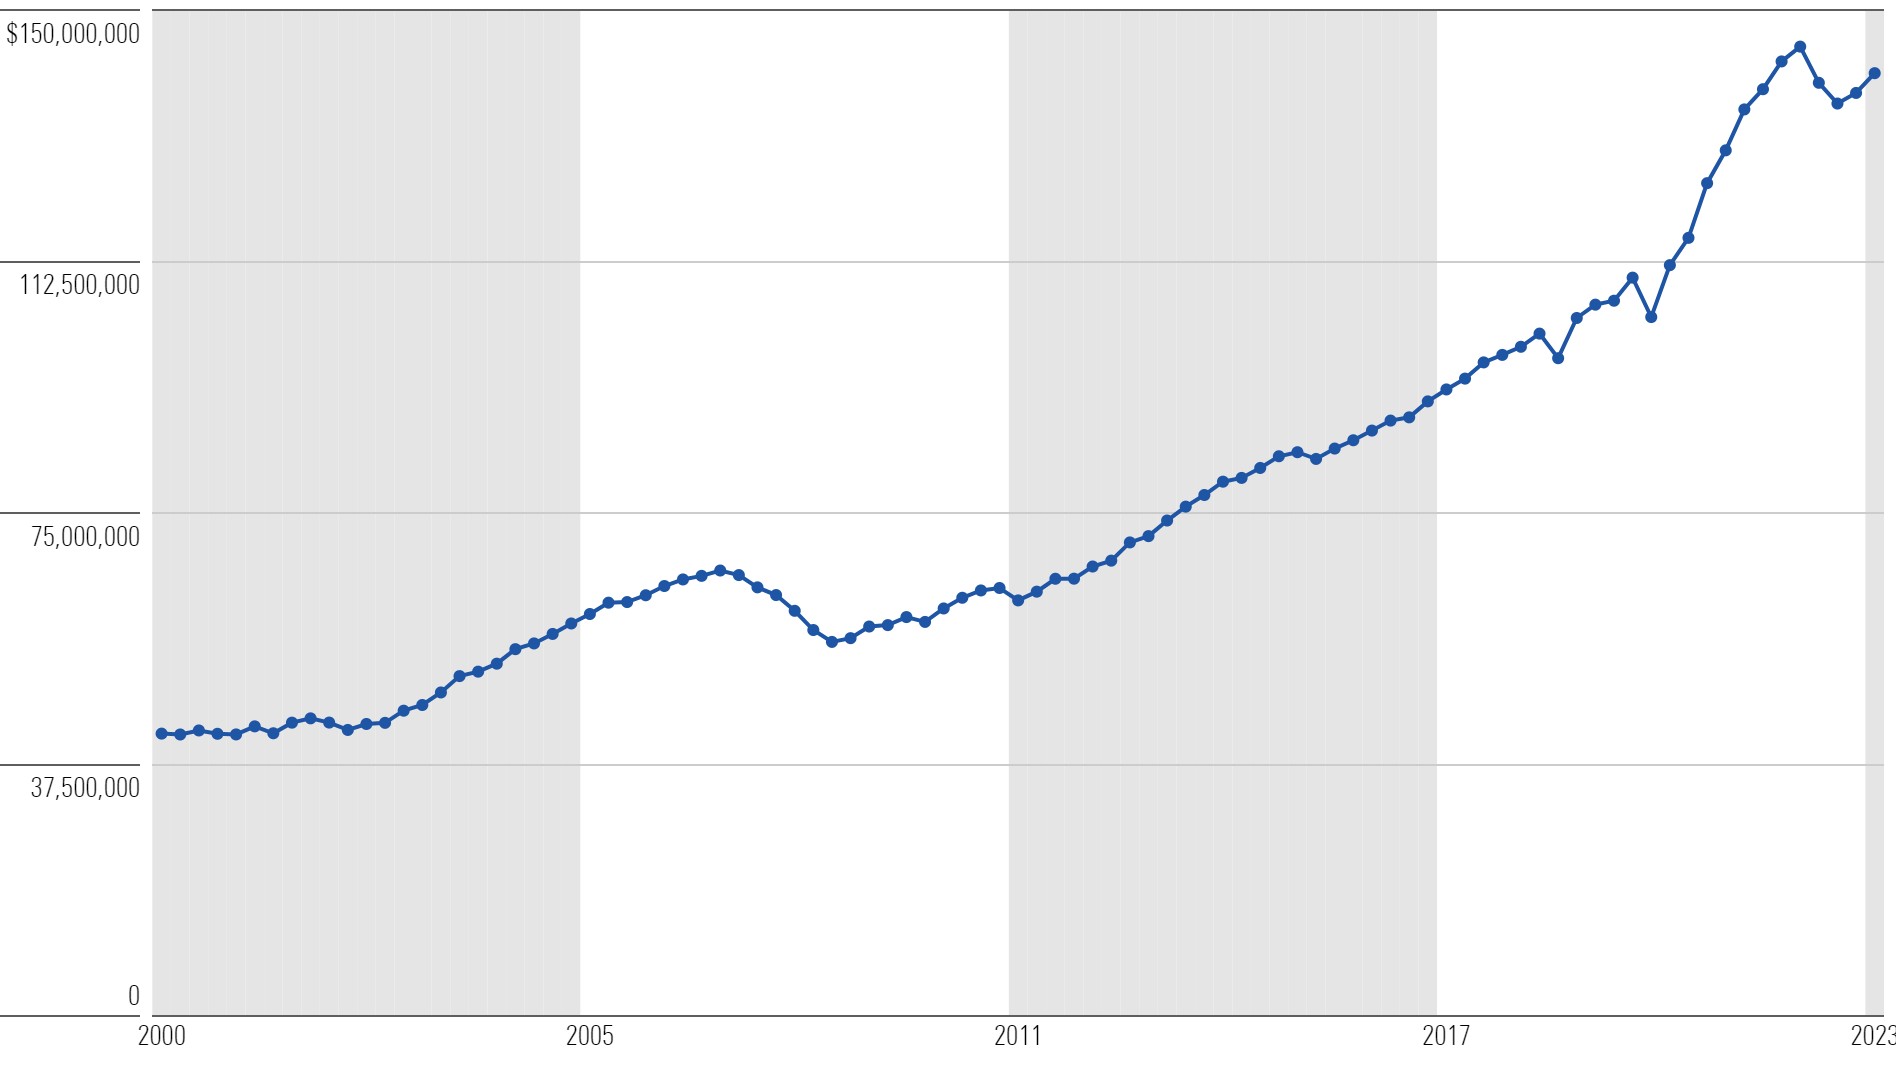
This concept—focus on the debt, ignore the assets—has sarcastically been coined “denominator blindness.”
Since 2013—using FRED data—credit card debt has increased by 65%, while household net worth increased by 99%.
This stat speaks to human nature—the more we have, the more we like to spend.
None of this means credit card debt is a good thing. Inside that $1 trillion sits many consumers who are struggling and paying sky-high credit card rates, but any narratives associating credit card debt as a looming black swan are likely missing the mark.
Morningstar Investment Management LLC is a Registered Investment Advisor and subsidiary of Morningstar, Inc. The Morningstar name and logo are registered marks of Morningstar, Inc. Opinions expressed are as of the date indicated; such opinions are subject to change without notice. Morningstar Investment Management and its affiliates shall not be responsible for any trading decisions, damages, or other losses resulting from, or related to, the information, data, analyses or opinions or their use. This commentary is for informational purposes only. The information data, analyses, and opinions presented herein do not constitute investment advice, are provided solely for informational purposes and therefore are not an offer to buy or sell a security. Before making any investment decision, please consider consulting a financial or tax professional regarding your unique situation.
The author or authors do not own shares in any securities mentioned in this article. Find out about Morningstar’s editorial policies.
/cloudfront-us-east-1.images.arcpublishing.com/morningstar/BL6WGG72URAJJJCPC4376SZKX4.png)
/cloudfront-us-east-1.images.arcpublishing.com/morningstar/ZHBXSNJYDNAY7HDFQK47HGBDXY.png)
/cloudfront-us-east-1.images.arcpublishing.com/morningstar/2TT3THVKOJAKBFGHCCRTVPNEQ4.png)