
3 ETF Investment Mistakes to Avoid
It’s easier to avoid a bad ETF than to choose a great one.
/s3.amazonaws.com/arc-authors/morningstar/5db00d6b-9c2f-4da7-8f94-da4290cf3b4a.jpg)
Exchange-traded fund investors are spoiled for choice. With thousands of ETFs covering numerous asset classes, there’s something for everyone. However, investors commonly choose ETFs that are:
- Too expensive
- Too risky
- Poorly constructed
Identifying and avoiding ETFs with any one of these traits can take investors most of the way to their goals. Here, we’ll both explain how to avoid making these errors and highlight some alternatives to common, but flawed, ETFs.
Too Expensive
A lot of ETFs charge high fees—for example, alternative ETFs typically charge many times the fee of broad-based index ETFs. While expensive, many funds charge fees in the range of what would be acceptable for an ETF of its kind.
Investors run into trouble when they pay a fee many times greater than that of a similar ETF.
Take First Trust Value Line Dividend ETF FVD and Schwab US Dividend Equity ETF SCHD. Both target U.S. stocks that pay high dividends. Both funds pay a high yield and are well diversified. There are nuances to their construction, but they’re both after the same thing—high dividend yield, solid returns, and less risk. Despite similar objectives, FVD has an expense ratio of 0.65%, while SCHD charges just 0.06%. There’s no reason to pay more for FVD given the funds’ similarities.
| Name | Ticker | Category | Fee | AUM | Yield | Medalist Rating | Process Pillar Rating |
|---|---|---|---|---|---|---|---|
| First Trust Value Line Dividend ETF | FVD | Large Value | 0.65% | $10.5B | 2.34% | Bronze | Above Average |
| Schwab US Dividend Equity ETF | SCHD | Large Value | 0.06% | $51.8B | 3.56% | Gold | High |
Data as of Jan. 18, 2024.
As a topical example—spot bitcoin ETFs began trading on Jan. 11. At the time of launch, fees ranged from 0.19% to 1.50% on the 11 newly minted ETFs (1). Each holds the same thing: bitcoin. There is no advantage gained by paying more for the same thing.
Why pay a higher fee if you don’t have to?
Too Risky
Every investor has a different risk tolerance. Matching an ETF to that risk tolerance is a challenge, but investors would do well to avoid needlessly risky funds. There are three ways to quickly gauge an ETF’s risk level:
- Volatility
- Drawdowns
- Concentration
Consider Invesco QQQ Trust QQQ, an ETF that tracks the performance of the largest 100 nonfinancial companies listed on the Nasdaq exchange. By any measure, historical performance has been phenomenal, but it has also been volatile. Over the past two decades, QQQ’s volatility was 23% higher than Vanguard S&P 500 ETF VOO while its drawdowns were steeper, too.
Vanguard S&P 500 ETF VOO is better diversified than QQQ, which leads to a more benign and predictable experience for investors. QQQ allocates half of its portfolio to technology stocks, higher than VOO’s 30%, and SCHD’s 12%. This presents elevated concentration risk for QQQ investors—holdings that share similar characteristics don’t do a good job diversifying risk. Returns will be dependent on the handful of large technology stocks that make up the bulk of its portfolio.
Long-term QQQ investors have enjoyed strong past returns, but those unable to stomach sharp drawdowns or high volatility may want to look elsewhere. Index ETFs like VOO or even SCHD may not be as flashy, but they do a better job controlling risk.
With QQQ, Higher Return = Higher Risk
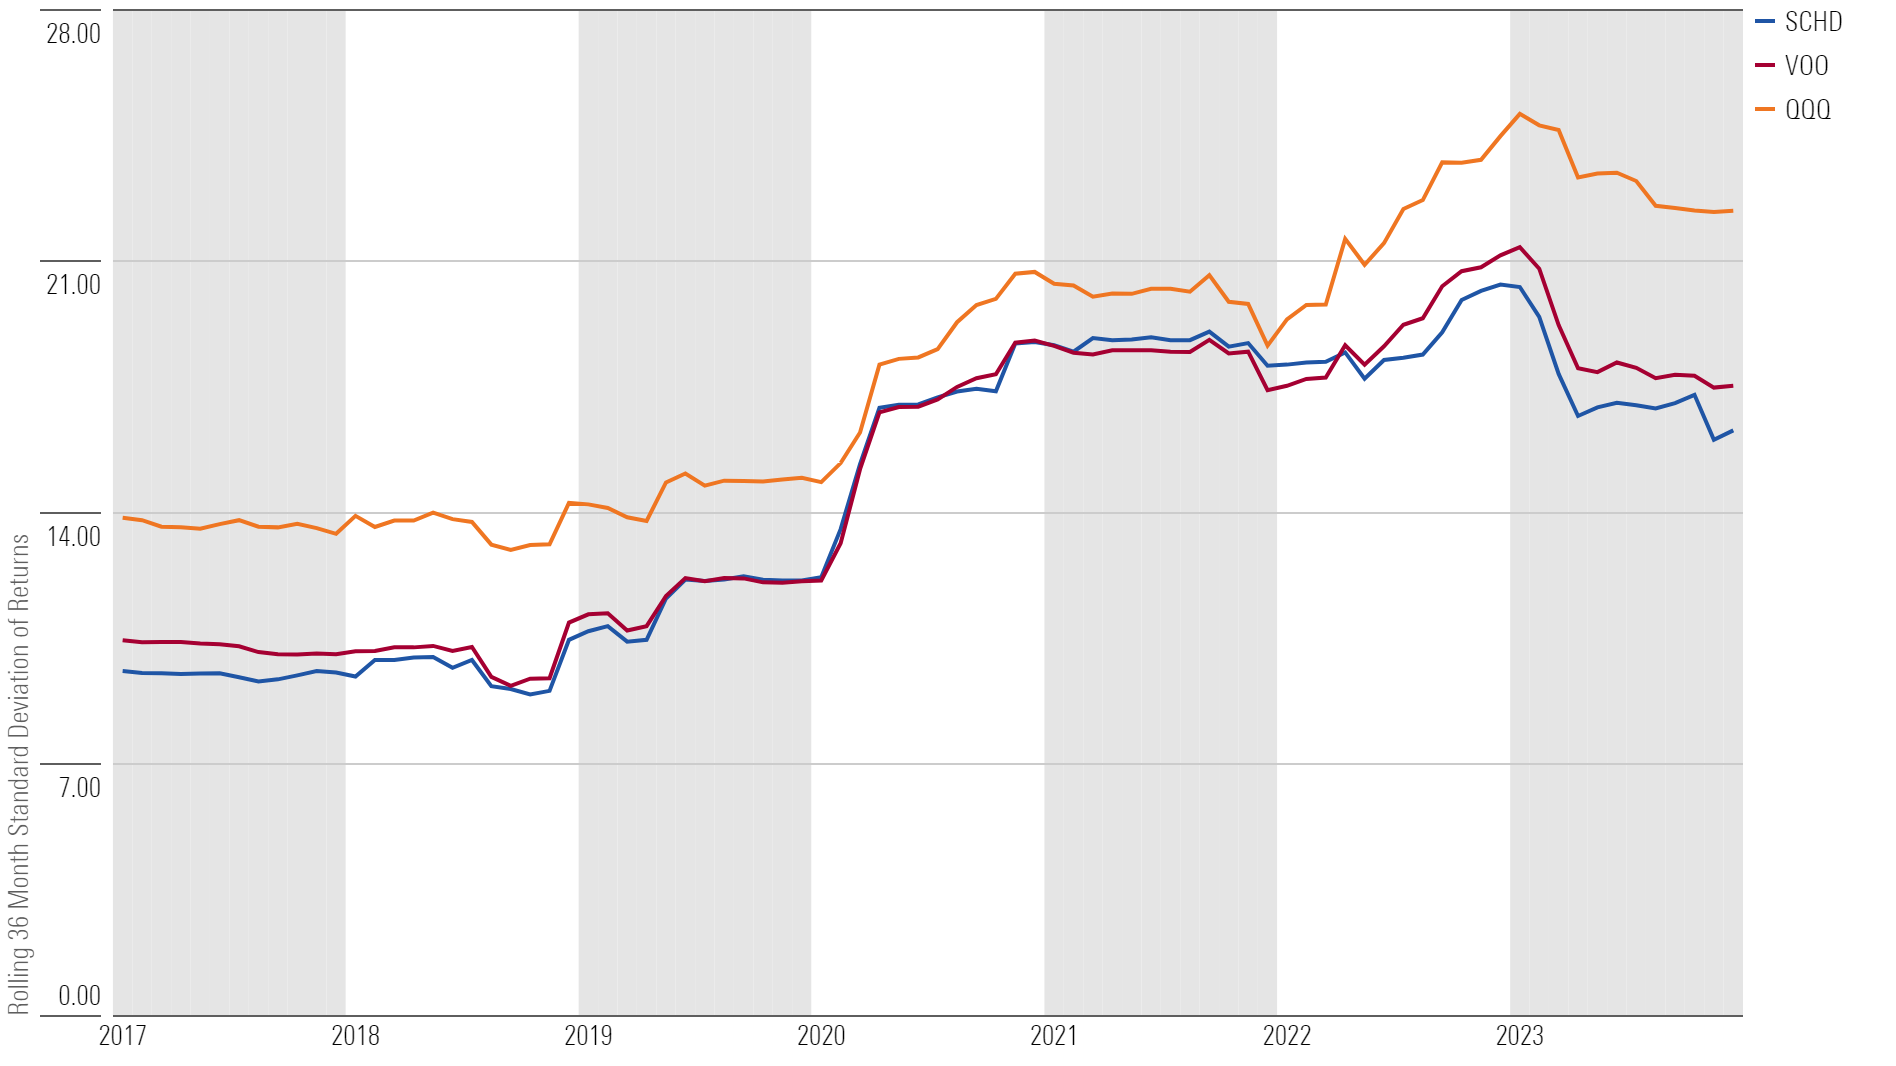
Source: Morningstar Direct. Data as of Dec. 31, 2023.
Poorly Constructed
While an ETF’s fee and risk level are relatively easy to assess, understanding its investment strategy requires a little digging.
Many popular index ETFs track a sensibly constructed, well-diversified index. Many of these, like Schwab US Broad Market ETF SCHB, are also very cheap. That’s a big win for investors. However, some poorly designed indexes slip through the cracks. These, if chosen, may surprise investors when things go awry. To avoid index ETFs like these, investors should ask one question:
Is there an economic rationale behind the strategy?
If the answer is no, move on to the next.
There are plenty of examples of index ETFs that track indexes with compelling features:
- Vanguard Total Stock Market ETF VTI holds 3,700 stocks and market-cap-weights them to efficiently channel the market’s collective wisdom.
- Style ETFs, like iShares Russell 1000 Growth and Value ETFs, aim to outperform by selecting undervalued stocks (IWD) or those with superior growth prospects (IWF).
- Dividend ETFs like SPDR S&P Dividend ETF SDY can provide a stable portfolio and reliably high yield.
There are some examples, though, of ETFs tracking flawed indexes.
One of the oldest and most widely followed indexes was not meant to be an investable product in the first place, and therefore lacks an economic rationale.
SPDR Dow Jones Industrial Average ETF DIA tracks the Dow Jones Industrial Average. This relic of the 1800s was created to estimate U.S. economic activity and not to provide a solid investment return. It only holds 30 stocks, and they’re weighted by their market price. Holding just 30 stocks presents concentration risk, and price weighting has no economic basis. Price weighting assigns a higher portfolio weight to stocks with a higher price, regardless of company size, earnings, or any other economic-bound reason.
Long-term investors should avoid ETFs that lack a sound economic rationale. ETFs like these are infrequent, but it’s always worth checking under the hood before investing.
7 of Our Favorite ETFs
| Name | Ticker | Category | Fee | AUM | Medalist Rating | Process Pillar Rating |
|---|---|---|---|---|---|---|
| Vanguard Total Stock Market ETF | VTI | Large Blend | 0.03% | $348.5B | Gold | High |
| Schwab US Broad Market ETF | SCHB | Large Blend | 0.03% | $25.2B | Gold | High |
| Vanguard S&P 500 ETF | VOO | Large Blend | 0.03% | $379.9B | Gold | High |
| iShares Russell 1000 Growth ETF | IWF | Large Growth | 0.19% | $81.6B | Silver | Above Average |
| iShares Russell 1000 Value ETF | IWD | Large Value | 0.19% | $51.7B | Silver | Above Average |
| Schwab US Dividend Equity ETF | SCHD | Large Value | 0.06% | $51.8B | Gold | High |
| SPDR S&P Dividend ETF | SDY | Large Value | 0.35% | $20.3B | Silver | Above Average |
Data as of Jan. 18, 2024.
(1) Fee range excludes any waivers.
Qi Sang contributed to this article.
The author or authors own shares in one or more securities mentioned in this article. Find out about Morningstar’s editorial policies.
/cloudfront-us-east-1.images.arcpublishing.com/morningstar/EC7LK4HAG4BRKAYRRDWZ2NF3TY.jpg)
/cloudfront-us-east-1.images.arcpublishing.com/morningstar/T2LGZCEHBZBJJPPKHO7Y4EEKSM.png)
/d10o6nnig0wrdw.cloudfront.net/05-07-2024/t_9dca62d6f7b3444d90619b3637ec379b_name_file_960x540_1600_v4_.jpg)
:quality(80)/s3.amazonaws.com/arc-authors/morningstar/5db00d6b-9c2f-4da7-8f94-da4290cf3b4a.jpg)