
July ETF Flows Near Monthly Record, Settle for Silver
US ETFs raked in $117 billion in July, their second-highest total on record.
/s3.amazonaws.com/arc-authors/morningstar/30e2fda6-bf21-4e54-9e50-831a2bcccd80.jpg)

Key Takeaways
- Cool inflation data accelerated the expected timeline for interest-rate cuts and propelled the Morningstar US Core Bond Index to a 2.3% gain, its best since December 2023.
- The Morningstar Global Markets Index, a broad benchmark of worldwide equities, notched a 1.9% return.
- Small-cap and value stocks dominated their counterparts in a reversal from the prior 18 months.
- Investors piled $117 billion into US exchange-traded funds, the second-highest monthly total on record.
- Vanguard S&P 500 ETF VOO pushed its 2024 inflows to $54 billion—past the annual record of $51 billion. It will claim the new record, barring outflows over the next four months.
- The small-blend Morningstar Category raked in nearly $11 billion behind a surge of inflows into iShares Russell 2000 ETF IWM.
- Taxable-bond funds raked in $35 billion as 20 of its 21 categories posted inflows.
- International equity ETFs shed less than $1 billion in their first month of outflows since October 2023.
Low Inflation Reading Powers Bonds
Exhibit 1 shows the July 2024 returns for a sample of analyst-rated ETFs that cover major sections of the stock and bond markets. A blended global portfolio gained 2.1% in the latest chapter of a strong 2024 campaign. The blended strategy climbed nearly 8.3% from the start of 2024 through July.
July Market Performance through the Lens of Analyst-Rated ETFs
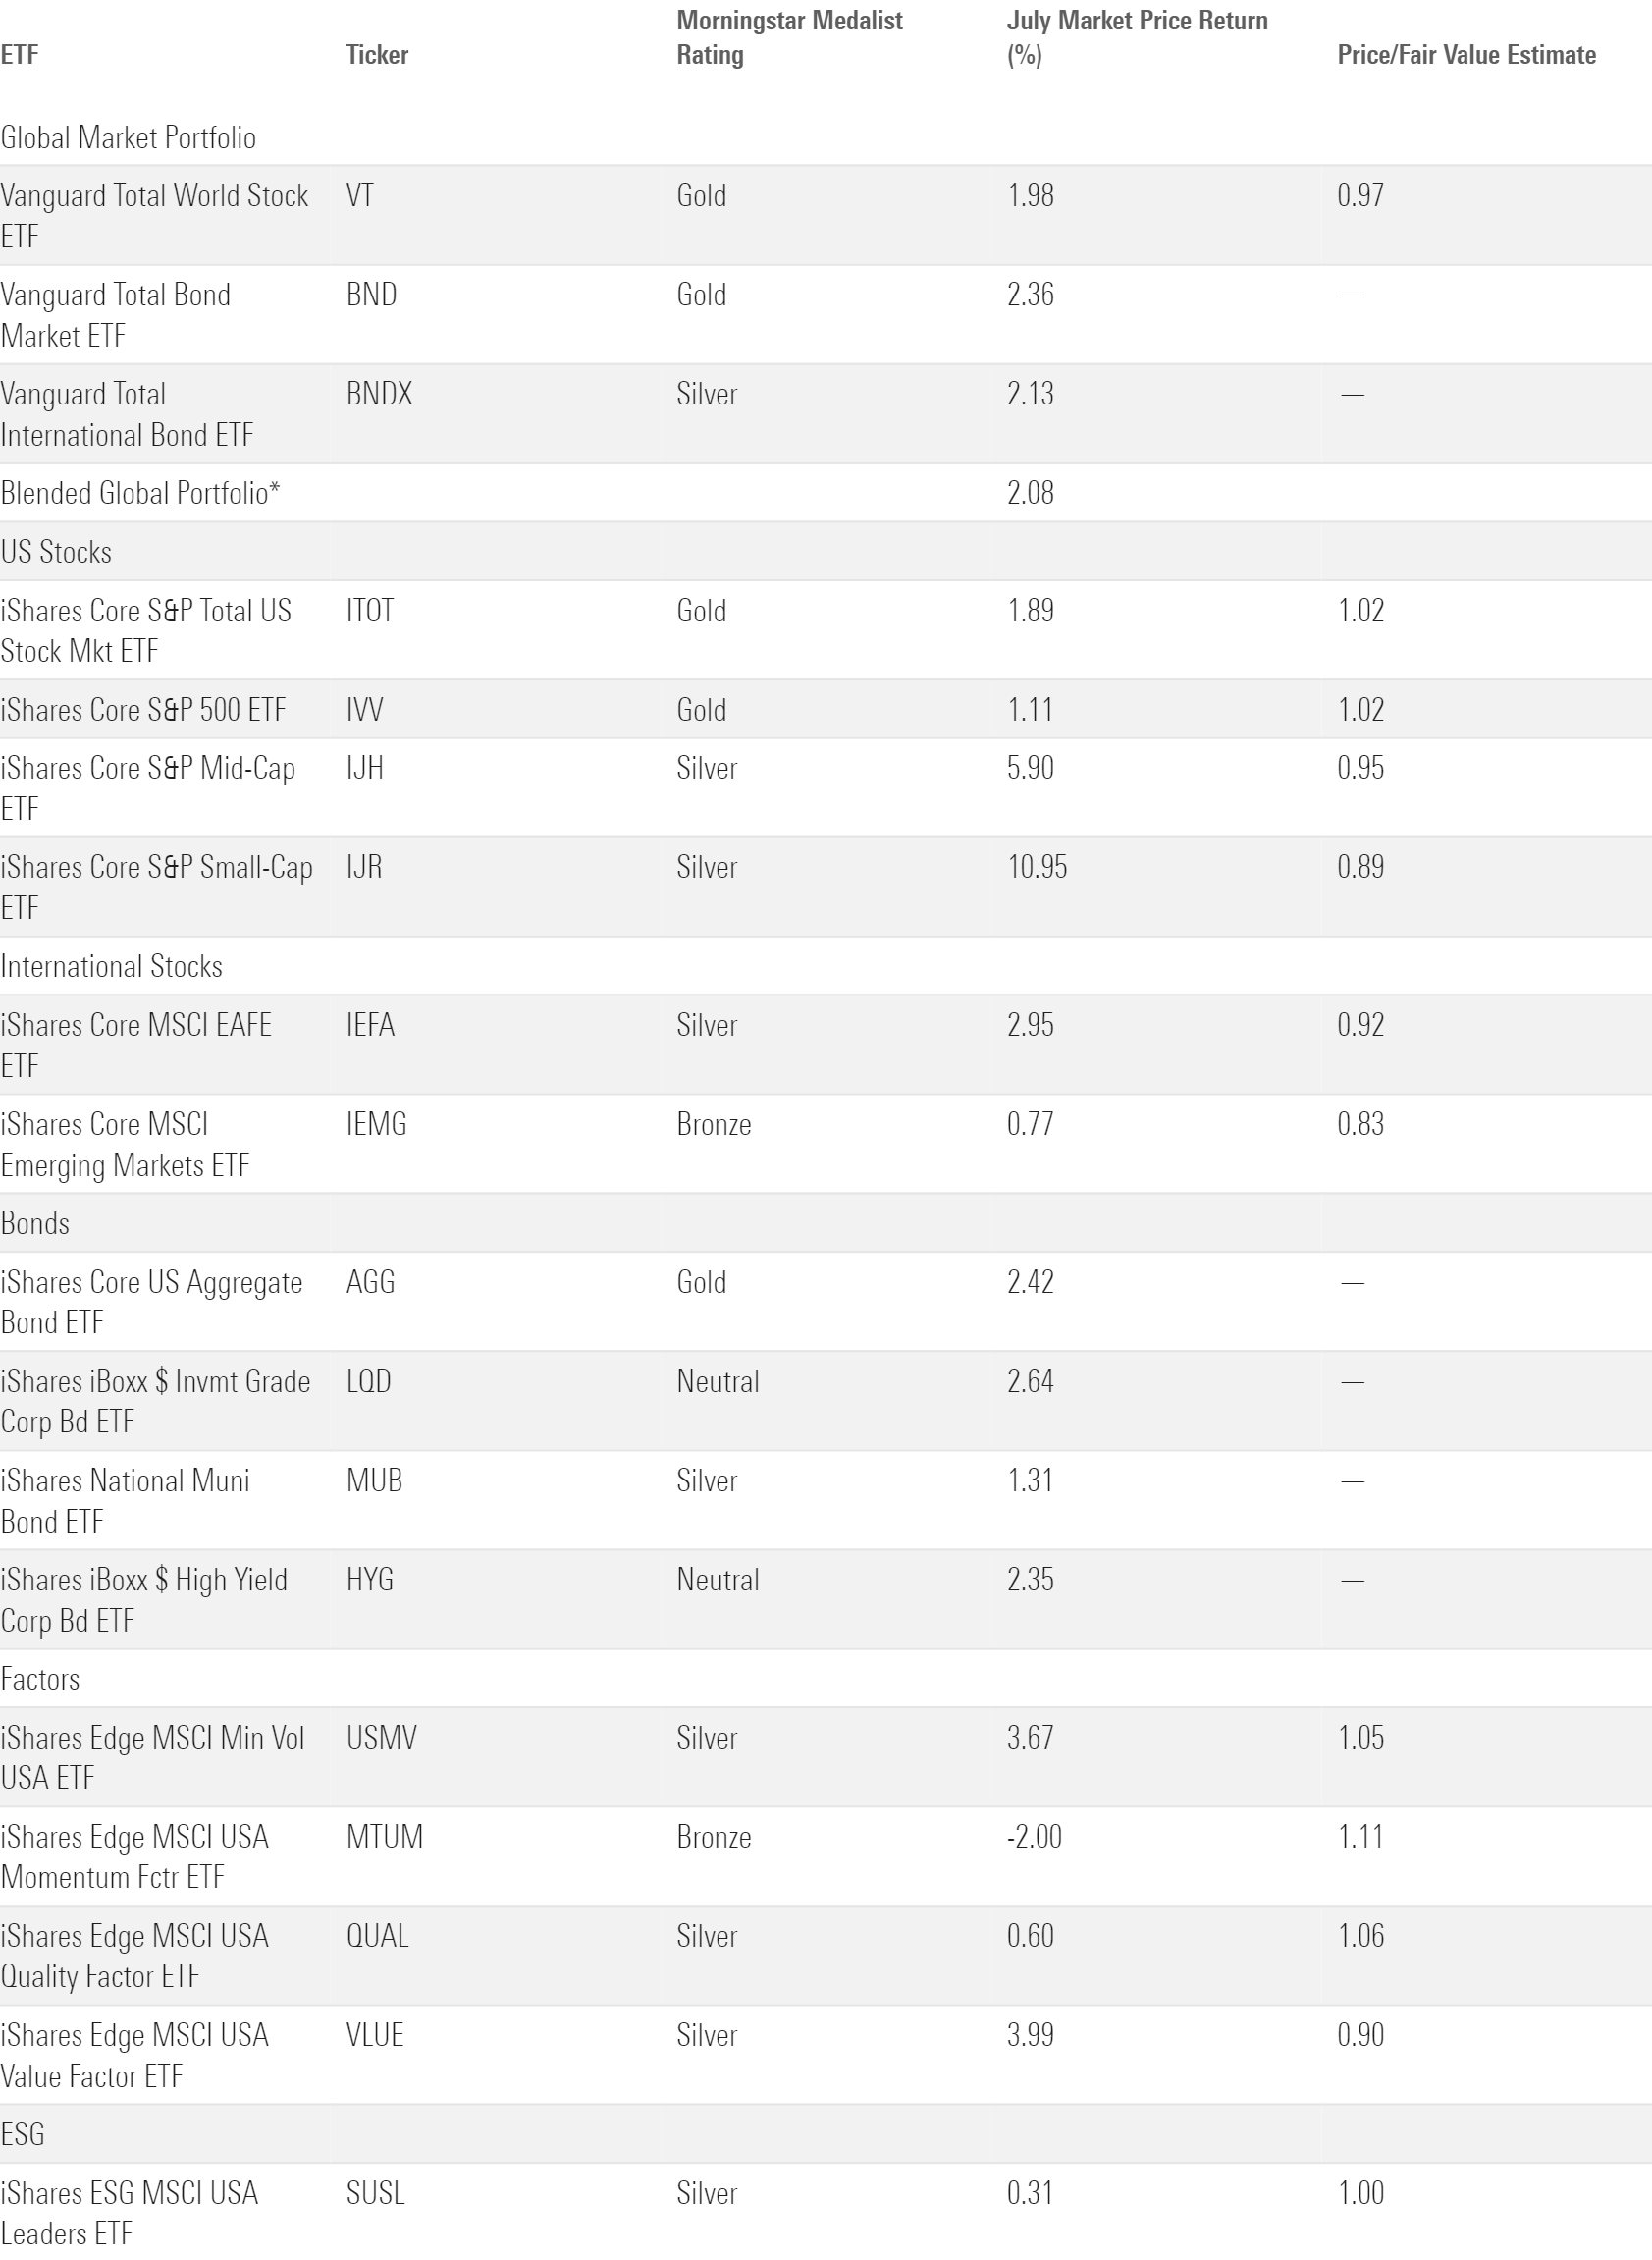
Bonds put a charge into the blended portfolio. Vanguard Total Bond Market ETF BND advanced 2.4% in July for its best month since December 2023. Bond prices have responded acutely to new inflation data for the better part of three years. July was one of the first times when that was a good thing. Inflation registered below the market’s expectation, accelerating the projected timeline for interest-rate cuts and driving up bond prices. IShares 20+ Year Treasury Bond ETF TLT, whose long-term holdings make it highly sensitive to rate changes, finished July 3.6% higher than where it started. IShares Short Treasury Bond ETF SHV closed July with a milder 0.5% gain.
Lower-quality bond portfolios also made out well in July. SPDR Bloomberg High Yield Bond ETF JNK advanced 2.2%, coming close to broad bond portfolios despite targeting bonds with shorter maturities. This fund rallied not just because of the inflation print, but the steady economic growth that accompanied it. July illustrated how a “soft landing” scenario looks: inflation low enough to bolster Treasuries but an economy healthy enough to nurture lower-quality corporate bonds. The second part of that equation would crumble in August, however, after a lackluster jobs report stoked fears that the US economy was headed downhill.
Cooler inflation data didn’t prompt the same jump in foreign bonds, but stacking positive days left Vanguard Total International Bond ETF BNDX with a 2.1% gain when the book closed for July. That marked its best month in 2024 and vaulted the fund into positive territory on the year, sporting a 1.6% year-to-date gain that trailed Vanguard Total Bond Market ETF by just 15 basis points.
3 Good ETFs When Interest Rates Fall
Small Caps and Value Break Out
Vanguard Total Stock Market ETF VTI gained 1.9% in July, a routine headline return that belies a major shift that unfolded beneath the surface. In a long-anticipated rotation, the market’s weaker pockets roared to life and sent the heroes of the past 18 months to the back burner.
The clearest reversal came along the lines of size, where small-cap stocks outshined large caps for the first time this year. IShares Core S&P Small-Cap ETF IJR shot up 11% in July, beating iShares Core S&P 500 ETF IVV by 9.8 percentage points, its widest one-month margin of victory since December 2000. The small-cap strategy lagged its larger counterpart by more than 15 percentage points over the first six months of 2024. Value and growth stocks acted out a similar story. Vanguard Value ETF VTV beat Vanguard Growth ETF VUG by 5.6 percentage points last month after trailing it by 12 percentage points in the preceding six. Real estate, utilities, and financials stocks, all popular in value indexes, led the rebound.
The same economic results that explained bond returns trickled through the equity market. Small caps tend to be more sensitive to rate changes than large caps and consequently jumped after the cooler inflation report. The real estate and utilities sectors—the market’s two best performers in July—rode the same wave, as they tend to be more bondlike than other corners of the market. Enthusiasm for stocks tied to the artificial intelligence theme started to wobble a bit in July. Five of the “Magnificent Seven” stocks lost value in July after a batch of middling earnings reports. Invesco S&P 500 Equal Weight ETF RSP beat the cap-weighted S&P 500 by 3.2 percentage points last month, its widest victory since February 2021 and a testament to the breadth of July’s rally.
July ETF Flows
Investors poured $117 billion into US ETFs in July. That fell short of the $128 billion that ETFs collected in December 2023, but it marked the second-highest monthly total on record and just the fourth time monthly flows exceeded $100 billion.
July has historically been a strong month for ETF flows. They grew an average 1.14% on an organic basis in July over the past 15 years—by far the highest among the summer months, which is otherwise a lethargic stretch for ETF inflows.
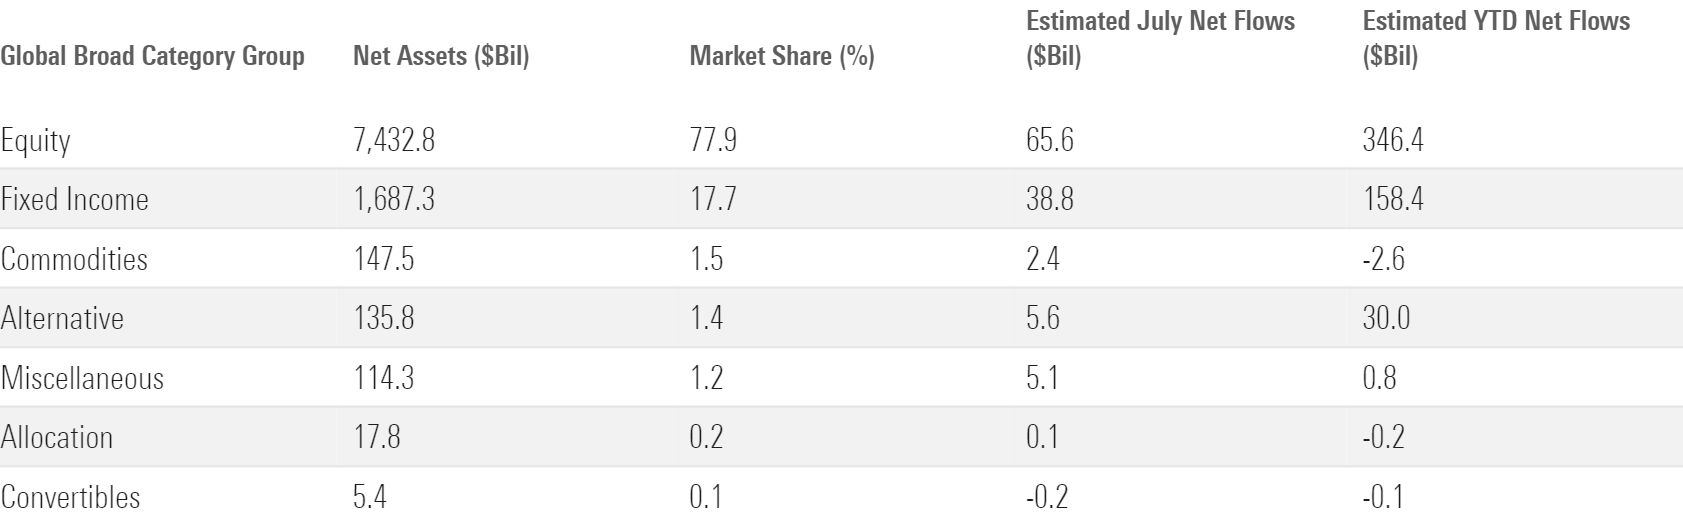
July Flows across Morningstar Broad Category Groups.
Stock ETF Flows
Small-cap stocks’ excellent performance clearly resonated with investors. After a slow first half befitting their weak returns, US small-blend funds raked in nearly $11 billion in July. That set a monthly inflow record and translated into a 1.9% organic growth rate, its best since November 2016 when the category was significantly smaller. IShares Russell 2000 ETF seized nearly $7 billion of inflows on its own. A favorite among traders and frequent turnstile for “hot money,” this fund’s day in the sun may be short-lived if small-cap stocks come back down to earth in the coming months.
Morningstar Categories with the Largest July Flows
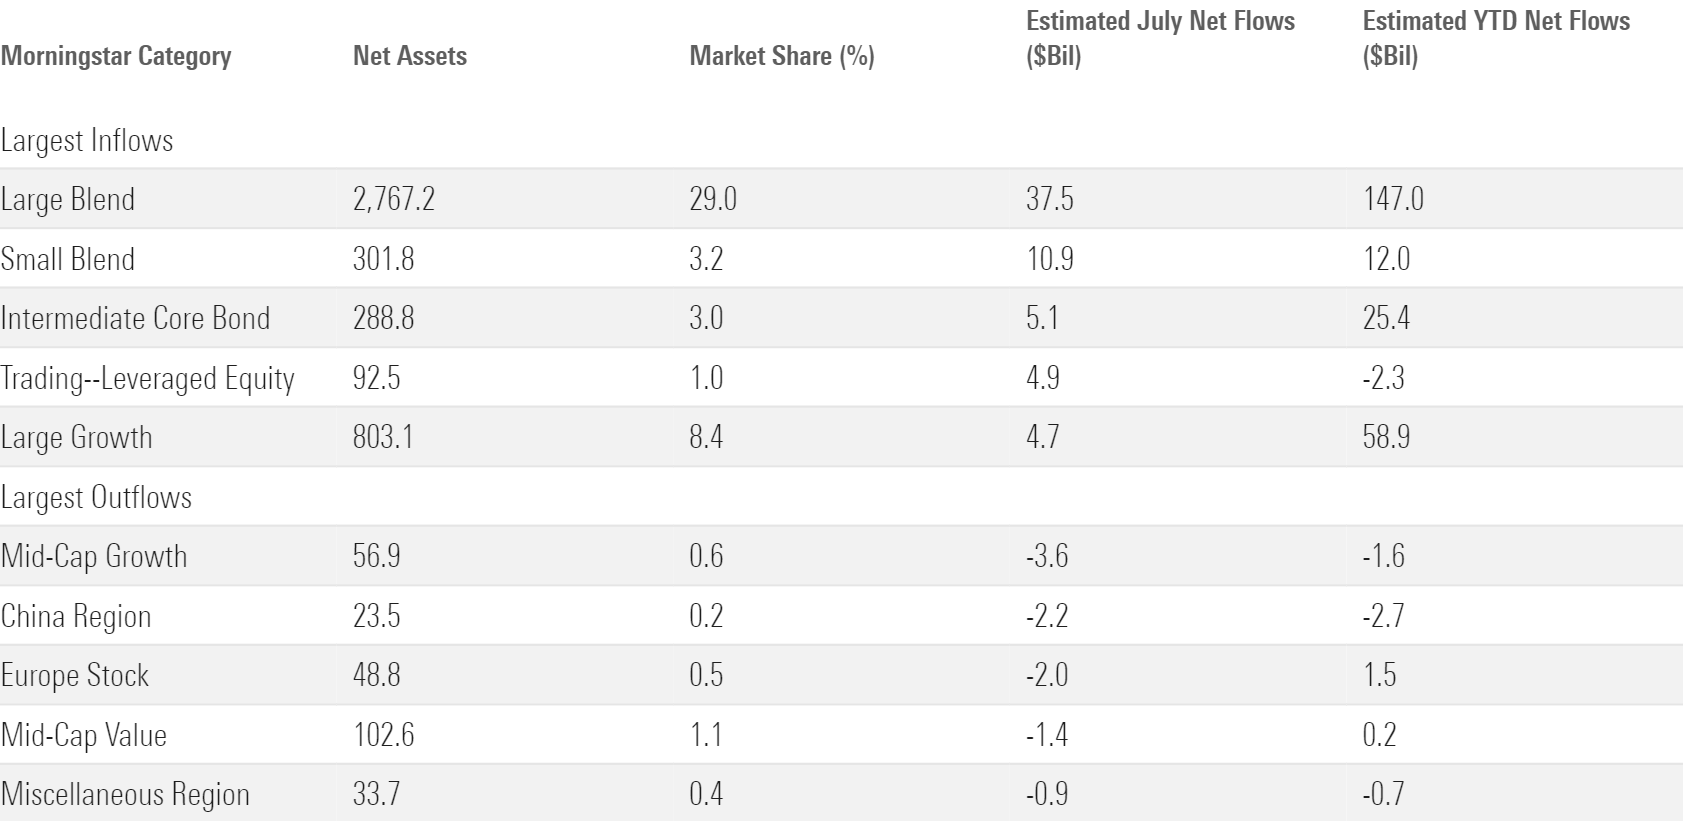
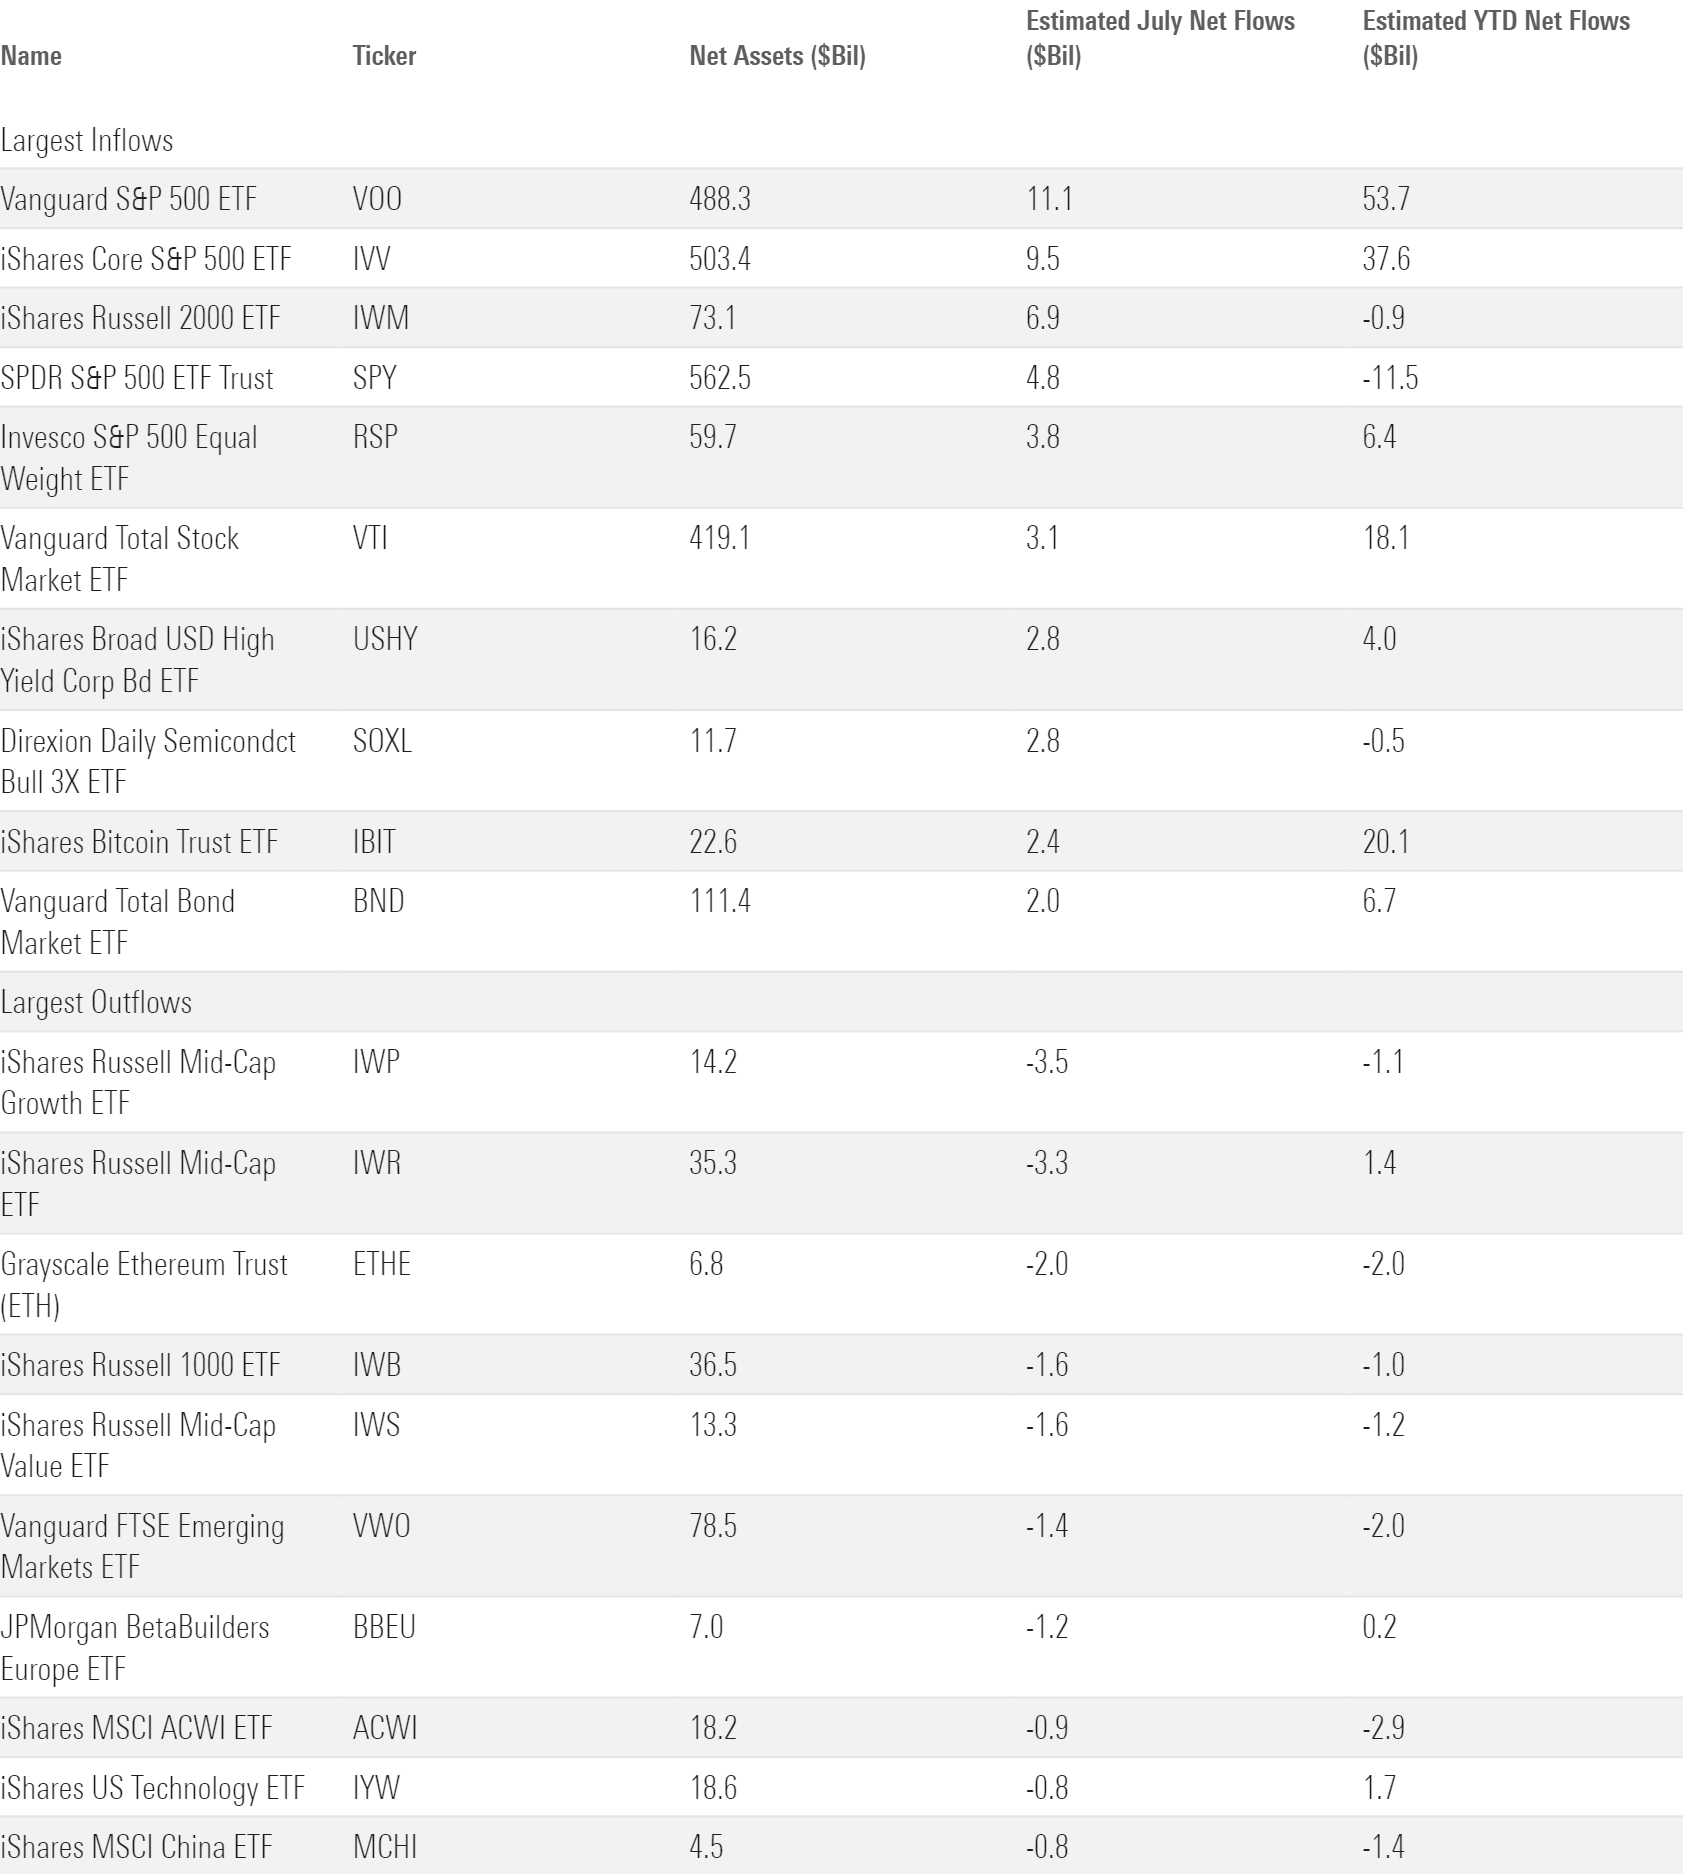
Predictably, US large-blend funds led the pack in terms of absolute flows. They pulled in nearly $38 billion in July, par for the course for the market’s largest segment. Vanguard S&P 500 ETF again finished atop the leaderboard. It has now collected nearly $54 billion in 2024, a fortune that exceeds the annual inflow record for a single ETF ($50.5 billion). Barring a stunning turnaround, the fund will finish the year with a fresh inflow record. The question now is: Just how big will that number be?
ETFs with the Largest July Flows
Sector ETFs raked in more than $8 billion in July, their most lucrative month since July 2023. More tactical investors were ready to jump on the stock market’s rotation. Financials paced the cohort with a $3 billion haul. Utilities, real estate, and healthcare, all mired in net outflows in 2024, welcomed new money in July. Weaker performance didn’t slow down technology funds, though. They gathered more than $2 billion behind healthy flows into semiconductor portfolios.
High demand for stock exposure did not spread overseas. International equity ETFs stayed roughly flat in July, leaking a modest $343 million that technically marked their first outflows since October 2023. Investors backed off funds that focused on the Asia-Pacific region. The China region category shed more than $2 billion—most among the cohort—and Japan stock, Pacific/Asia ex Japan stock, and diversified emerging markets (an Asia-heavy category) all endured outflows. Performance could be a factor: The Morningstar China Index rose just 2.3% for the year to date through July, about 10 percentage points behind the global market.
Bond ETF Flows
Taxable bond ETFs raked in more than $35 billion in July, another monthly record. That translated into a 2.4% organic growth rate, the cohort’s highest mark since May 2022. Investors may be jumping at high bond yields while they still can. Rebalancing could be at work as well: Restoring a stock/bond portfolio’s target allocation has required moving toward the bond sleeve due to equities’ leading performance.
July flows into taxable-bond funds were remarkably balanced. Twenty of the 21 taxable bond categories collected inflows, and none of them exceeded the $5 billion that streamed into the intermediate core bond category. Bond funds that court more credit risk fared well in July, too. The corporate, high-yield, and intermediate core-plus categories collectively hauled in nearly $10 billion. Flows into these bond sectors fluctuated between hot and cold to start the year, but investors have favored them in recent months as credit spreads have gradually narrowed.
The flows into riskier segments haven’t come at the expense of government bond funds. Treasury funds are a more direct bet on interest-rate movements, a status that helped them scoop up about $9 billion in July.
Quick Hits From the ETF Universe
- Spot ethereum ETFs debuted in July to much humbler fanfare than spot bitcoin ETFs in January. IShares Ethereum Trust ETF ETHA made the largest splash, with more than $600 million of inflows. But that didn’t signal net new demand. Grayscale Ethereum Trust (ETH) ETHE, the futures-based incumbent, bled roughly $2 billion on the month.
- The nontraditional-equity cohort reeled in $2.9 billion in July. Featuring mostly covered-call funds, the group has not endured outflows since March 2020. Even more remarkably, its inflows ranged between $2.3 billion and $3.0 billion in each month this year. That consistency is hard to find.
- Commodities ETFs cleared $2 billion of inflows in their best month since March 2022. Precious metals led the way; SPDR Gold Shares GLD raked in $1.4 billion of that total. Gold has quietly compiled a very nice 2024 campaign. SPDR Gold Shares advanced 15.4% from the start of 2024 through July, leading many major equity indexes. Gold has performed better after inflation took root than it did during its rise, a frustrating outcome for investors who bought it for shelter in 2021 and 2022.
- Widespread inflows didn’t find their way to thematic ETFs, which shed about $1.5 billion in July and nearly $5 billion on the year. Two themes have bucked the trend with inflows north of $1 billion apiece: political and artificial intelligence, a fitting duo for 2024.
Star ETF Powers Janus
BlackRock, Vanguard, and State Street dominated the leaderboard with nearly $75 billion of combined inflows in July. That haul is stellar but unsurprising: The three largest providers represent nearly three fourths of the market. July was another example of the top trio living up to its billing.
July Flows for the 10 Largest ETF Providers
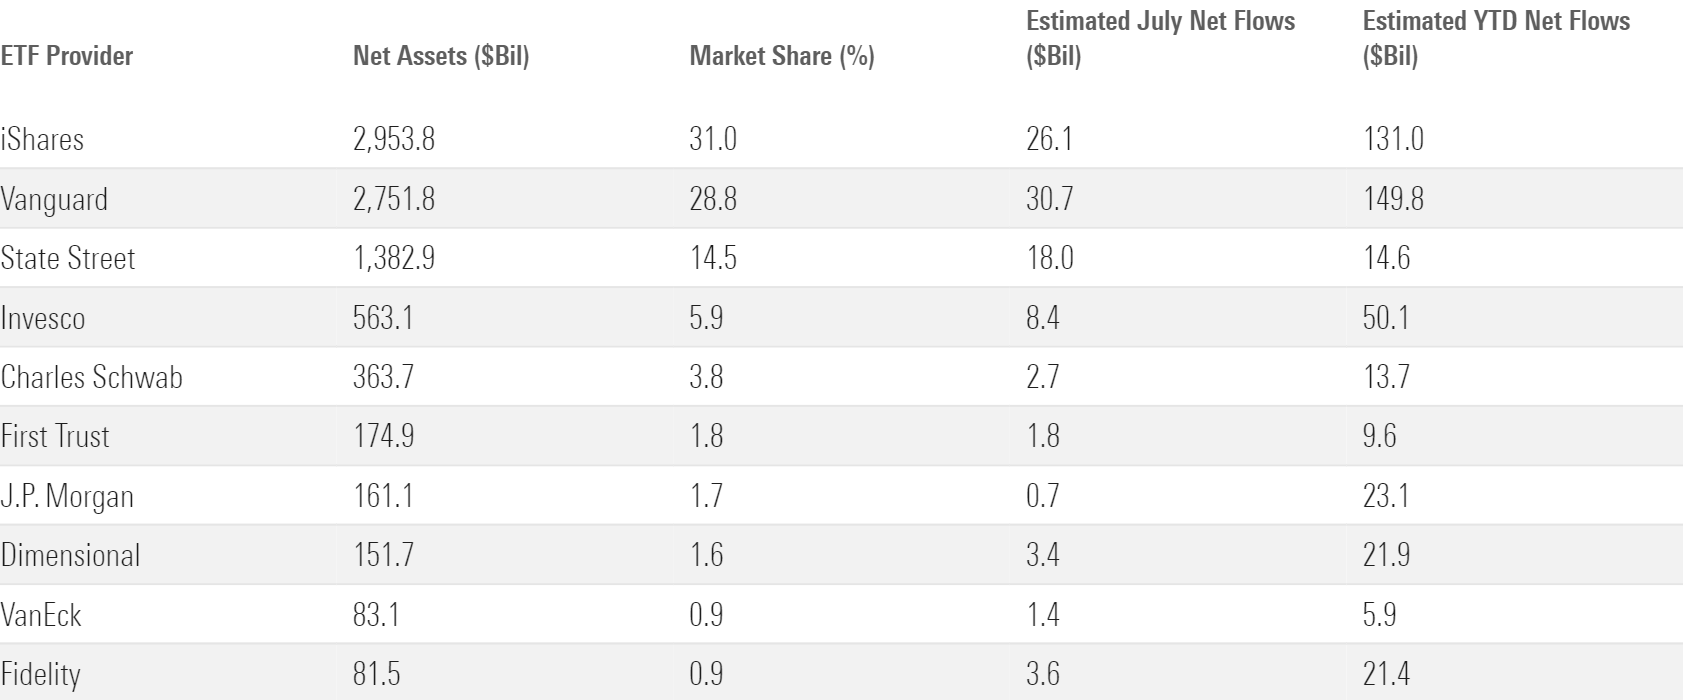
Janus Henderson has a much smaller ETF footprint, but it has made a statement of its own this year. It collected $8 billion on the year after entering it with just $12 billion total. That translated into a 67% organic growth rate so far this year, third most among providers with at least $10 billion in tow (BlackRock and Capital Group rank slightly ahead).
One engine has powered Janus’ breakout year: Janus Henderson AAA CLO ETF JAAA. This actively managed hit has raked in more than $6 billion for the year to date; the rest of its ETFs combined for about $2 billion. The now-$12 billion ETF took off thanks to a combination of its solid track record, gaudy yield, catchy ticker, and proximity to the red-hot theme of private credit. Broad demand for fixed income set the optimal backdrop.
Including mutual funds, Janus Henderson has endured outflows in eight consecutive calendar years, as investors soured on the active open-end funds that populate most of its lineup. But its star active ETF may flip the script. Its inflows have concealed mutual-fund outflows and nudged Janus into positive territory for 2024. Many active-oriented fund families have tried to reverse their outflows with ETFs. It’s no easy feat, but striking gold with one that takes off certainly changes the calculus.
One Valuation Doesn’t Fit All
The fair value estimate for ETFs rolls up our equity analysts’ fair value estimates for individual stocks and our quantitative fair value estimates for stocks not covered by Morningstar analysts into an aggregate fair value estimate for stock ETF portfolios. Dividing an ETF’s market price by this value yields its price/fair value ratio. This ratio can point to potential bargains and areas of the market where valuations are stretched.
The 10 Most Under- and Overvalued Analyst-Rated ETFs
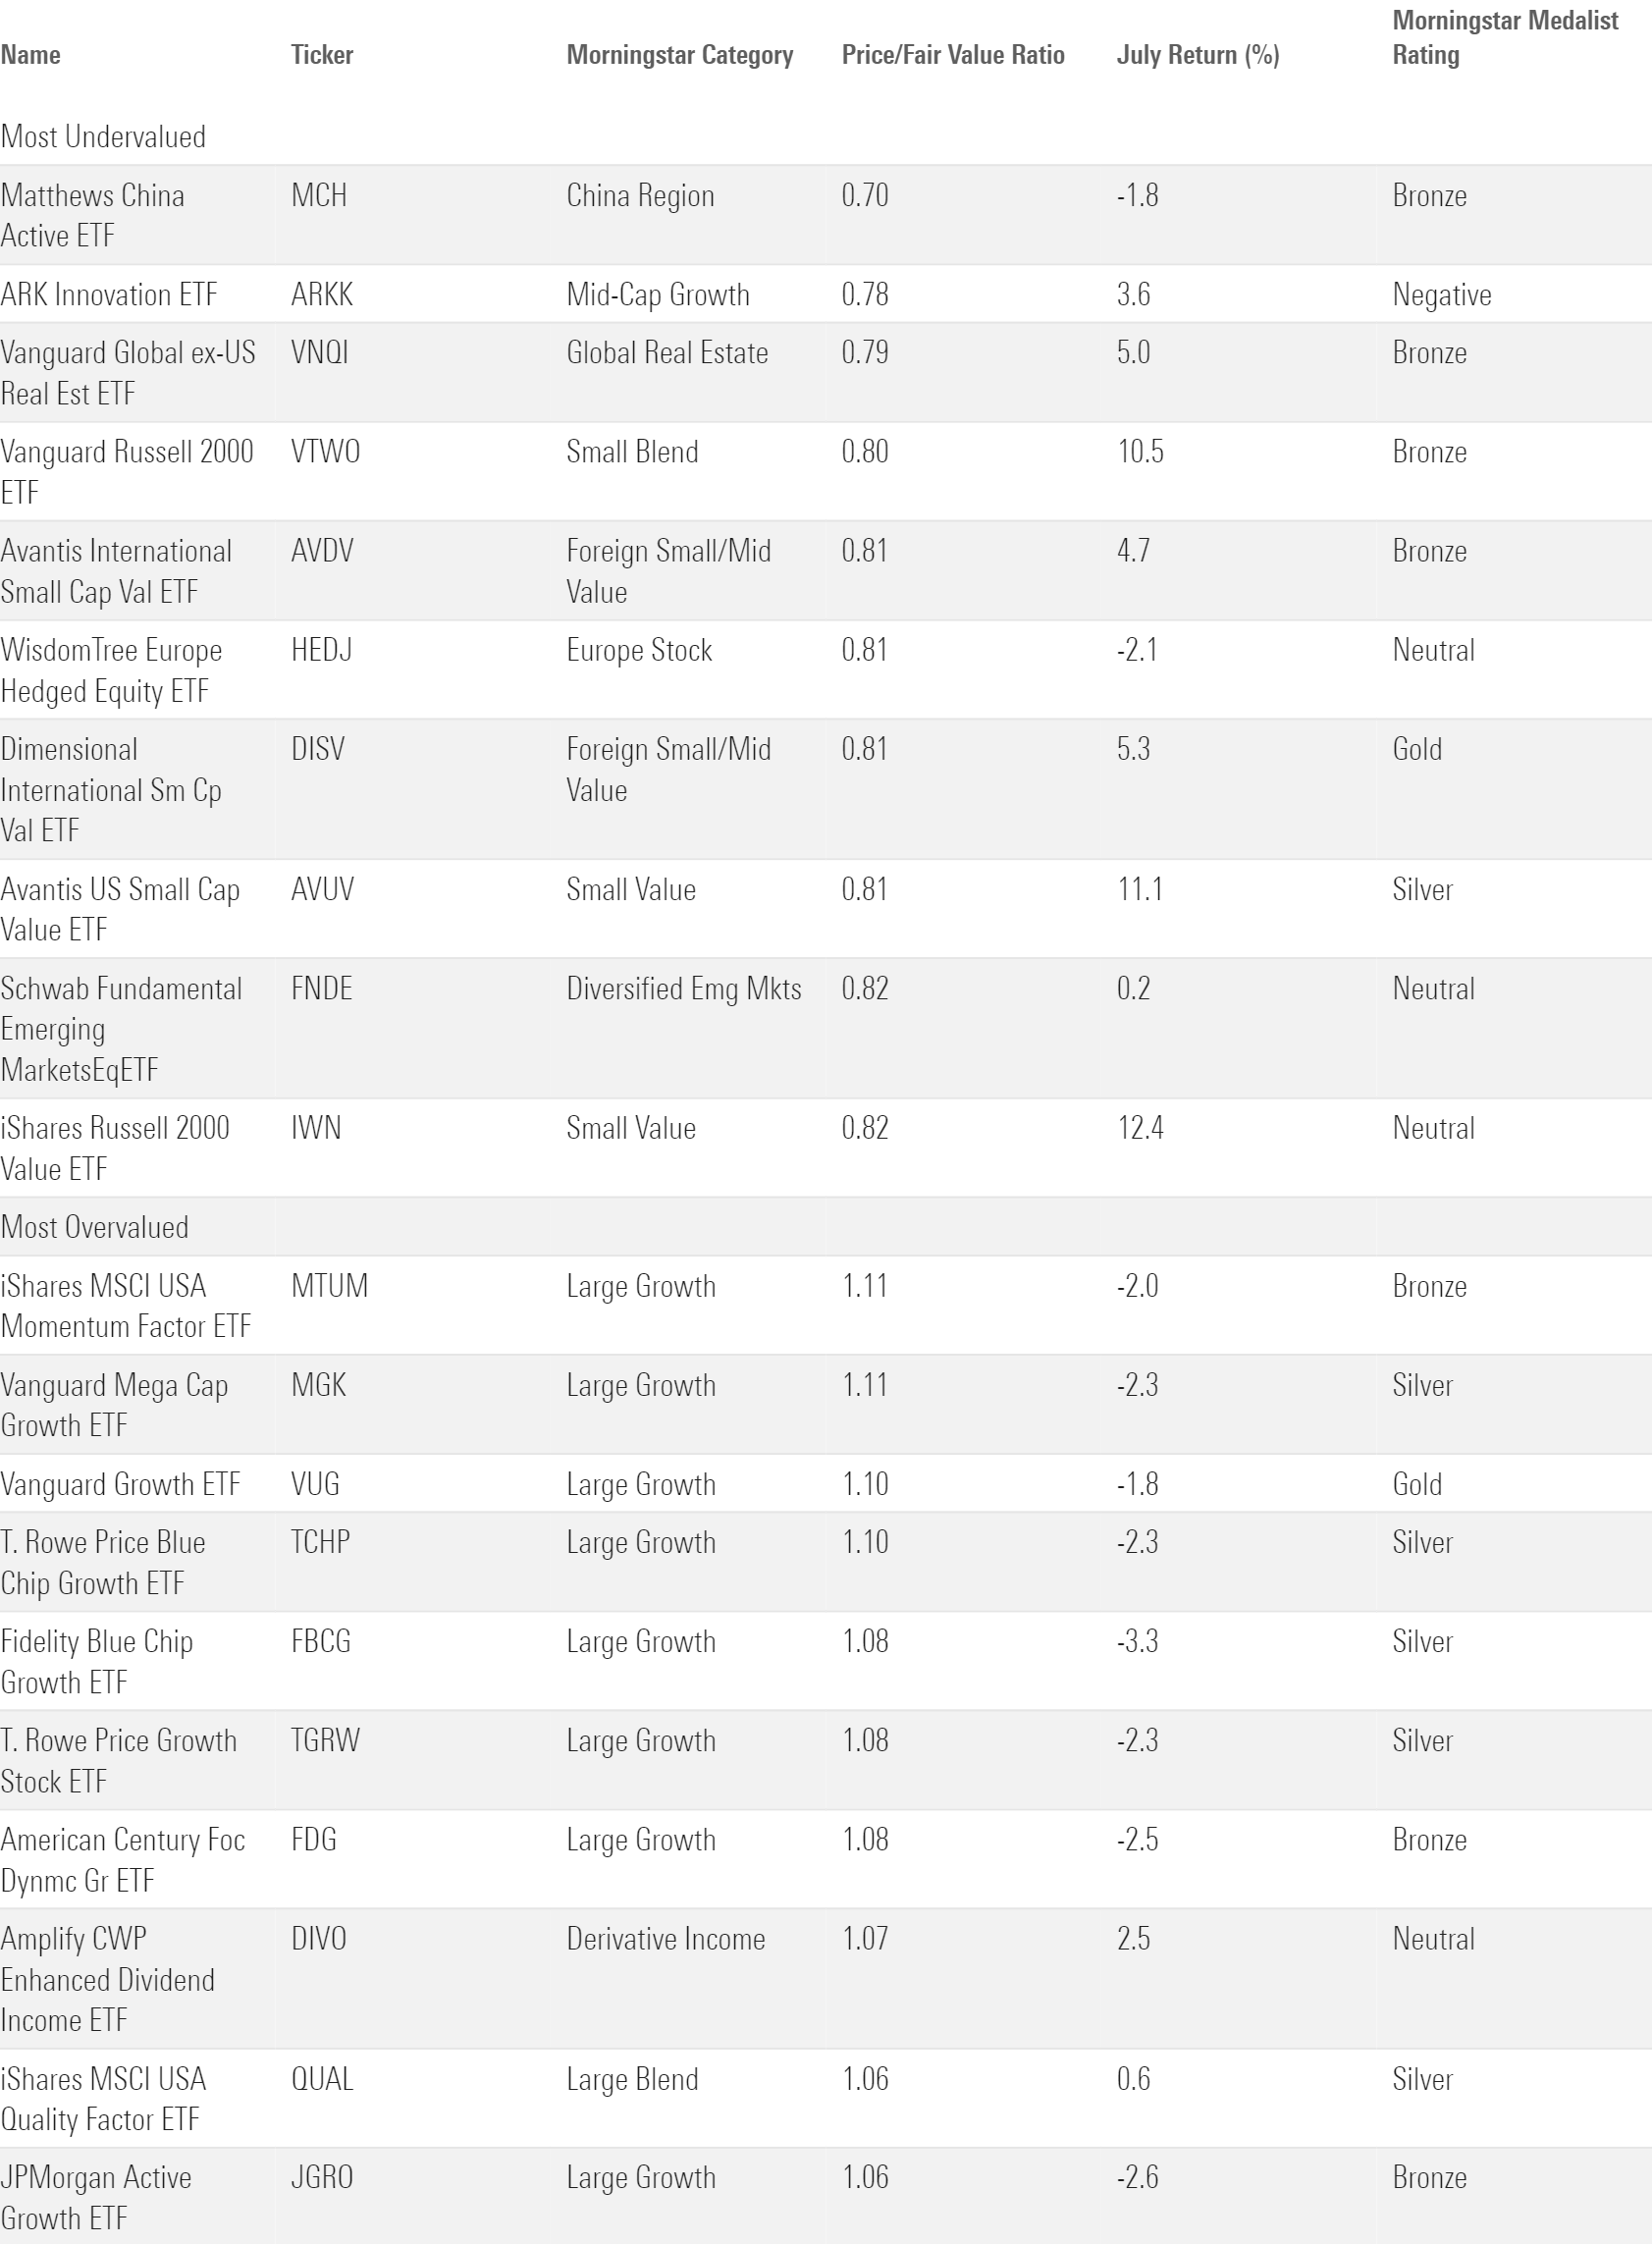
Morningstar chief US market strategist David Sekera recently published the US stock market outlook for August 2024, a report that draws on the price/fair value ratio. It highlights small-cap and value stocks for their modest valuations, even after both cohorts enjoyed strong July performance.
Investors should note that the ETFs covering these sections of the market can vary in valuation. That’s especially true when concentrated active ETFs enter the equation. For instance, American Century Focused Large Cap Value ETF FLV, which has a Morningstar Medalist Rating of Bronze as of June 2024, is a defensive strategy whose portfolio ranges from 30 to 50 holdings. It traded 11% below its fair value as of July 2024. Silver-rated IShares MSCI USA Value Factor ETF VLUE and T. Rowe Price Equity Income ETF TEQI were on sale too, offering discounts of 9% and 7%, respectively. Meanwhile, eight funds in the large-value category traded above their fair value at July’s end. Just because a category looks cheap does not mean the same for all the options within it.
The author or authors do not own shares in any securities mentioned in this article. Find out about Morningstar’s editorial policies.

/d10o6nnig0wrdw.cloudfront.net/09-24-2024/t_c34615412a994d3494385dd68d74e4aa_name_file_960x540_1600_v4_.jpg)
/cloudfront-us-east-1.images.arcpublishing.com/morningstar/T2LGZCEHBZBJJPPKHO7Y4EEKSM.png)
:quality(80)/s3.amazonaws.com/arc-authors/morningstar/30e2fda6-bf21-4e54-9e50-831a2bcccd80.jpg)