
How Fast Will Active Equity ETFs Grow?
Likely not as fast as passives did; many are already on life support.
/s3.amazonaws.com/arc-authors/morningstar/b0c51583-b9a2-49eb-9a8f-5f25a8bda4a3.jpg)
Asset managers are jockeying for pole position at the start of what many expect to be the investment industry’s next big growth trend: actively managed exchange-traded funds.
It is reasonable to expect assets to migrate from traditional active equity mutual funds to stock-picking ETFs. After all, passive equity investors have been opting for ETFs for years. Stock-index-tracking ETFs had less than 8% of passive equity assets at the millennium’s start but nearly half of indexed money by 2010. That growth has slowed, but ETFs continue to eat away at mutual fund’s asset share as most new money flows into the ETF vehicle. For instance, in the first six months of 2024, ETFs accounted for 80% of inflows into passive equity portfolios.
As of June 2024, active equity ETFs accounted for roughly 4.5% of all actively managed equity assets, about the same as ETFs’ share of passive assets in 1997. If you assume active investors appreciate the key advantages of ETFs—low fees, tax efficiency, transparency, and trading flexibility—as much as passive investors, it’s tempting to predict active ETFs are going to follow the same dramatic growth trajectory as their passive cousins shown below.
Percentage of Equity Assets Invested in ETFs
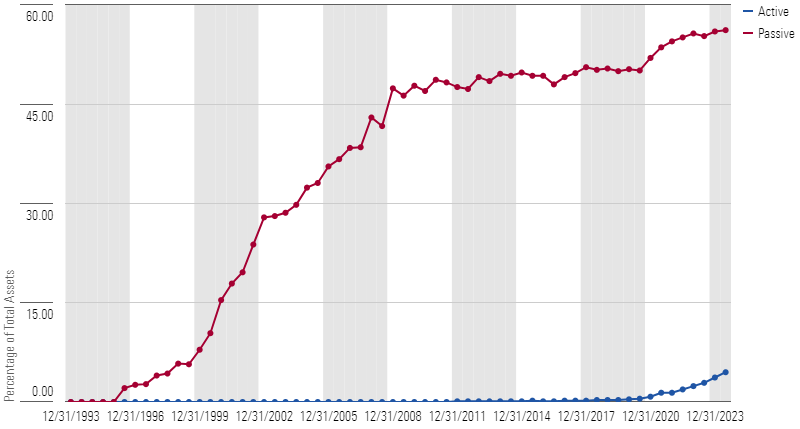
The fight for market share will likely be more of a slog in the active space for ETFs, though. Passive index funds are commodities. An index mutual fund’s portfolio should be virtually identical to that of an ETF tracking the same index or market segment. If investors can get the same exposures with lower fees, better tax efficiency, and easier trading, each of which ETFs offer, why wouldn’t an investor switch?
Active equity ETFs are a tougher sell. The switching costs of moving from an active stock mutual fund to an ETF are higher. A passive investor wants to track the market or a portion of it; an active investor wants to beat it. Before an active investor jumps to the ETF version of an active strategy with which the investor is happy, that fundholder needs to be confident the ETF can deliver the same or better experience. Many fund companies, however, are hesitant to roll out ETFs that are exact clones of existing active equity mutual funds, partly because they fear an exodus of assets from higher to lower fee versions of the same strategies. So, for investors, the decision to move from a traditional active equity fund to an active stock ETF is not a no-brainer; it requires some due diligence and discretion.
Are the Hot Active ETFs Really ‘Active’?
Two firms have dominated active equity ETF flows and assets since 2020, though they are not exactly your prototypical active stock-pickers. Dimensional Fund Advisors and Avantis Investors combined accounted for $172 billion of the $322 billion invested in actively managed equity ETFs as of June 2024. DFA’s and Avantis’ offerings, however, follow systematic equity approaches that tilt indexlike portfolios toward factors that have been correlated with outperformance, such as size, value, and quality. Like index fund investors, DFA or Aventis fundholders would not notice much difference between mutual funds and ETFs targeting the same market areas and factors; switching costs are low. As shown below, they have accounted for the bulk of cumulative inflows into active ETFs since 2020.
Cumulative Net Flows into ETFs by Issuer
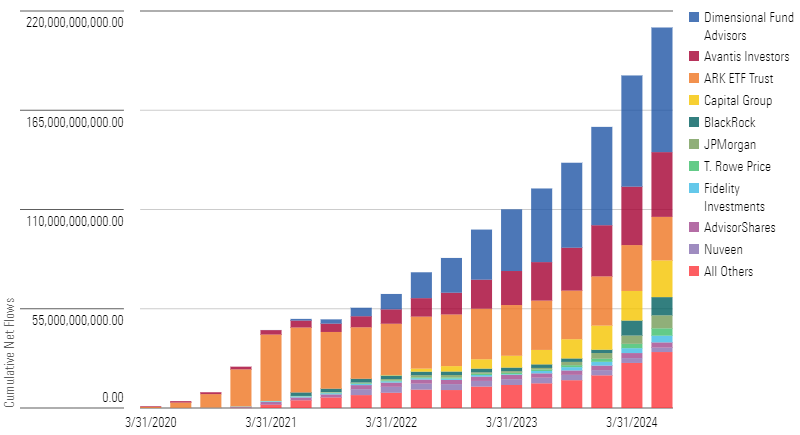
To date, the most successful pure stock-picking firm in terms of aggregate flows is ARK Investment Management, which collected massive inflows in late 2020 and early 2021. The firm has seen more than a billion in outflows since the start of 2022, though those numbers are a bit misleading; ARK ETFs (particularly ARK Innovation ARKK) destroyed billions in investors’ wealth, so most investors have significantly less to withdraw than they put in.
Cannibalization Is Real
So far, fund companies’ cannibalization worries—or fears that their active ETFs would consume the flows and assets of their mutual funds—seem to be well-founded for active portfolios. Yet, it is the clones that are attracting money, as clones naturally have lower switching costs for investors. Clones have attracted about $105 billion of the $188 billion (56%) of total inflows into active equity ETFs since the start of 2021 despite only accounting for 13% of fund offerings. For the most part, clone ETFs have cannibalized their mutual fund siblings’ assets, but it isn’t clear that they are attracting new money. The exhibit below shows the net flows for equity strategies in Morningstar’s database that have both mutual funds and ETFs. Clearly, any ETF’s asset growth has come at the direct expense of their mutual funds.
Quarterly Flows by Vehicle: Strategies That Offer Both ETF and Mutual Fund
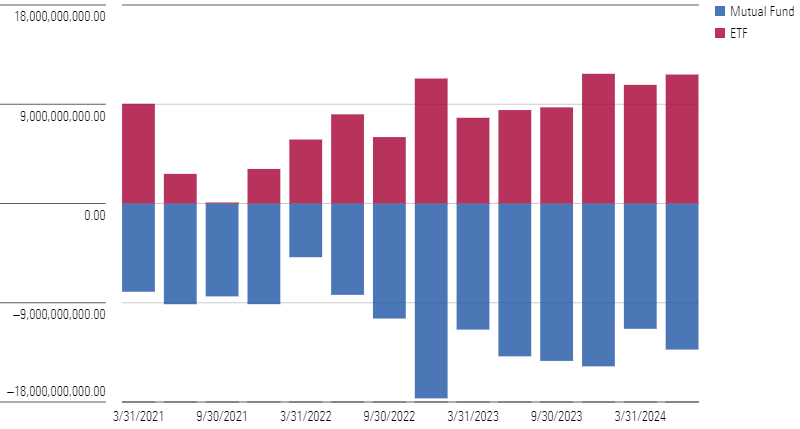
However, it appears there has been some asset leakage along the way. Mutual funds with ETF clones, together, have seen a cumulative $50 billion in outflows since the start of 2021. One strategy—T. Rowe Price Blue Chip Growth TRBCX—accounts for much of that leakage. Its mutual fund has seen roughly $50 billion in outflows since 2020, while its ETF clone TCHP has attracted less than $500 million of inflows.
Dimensional, on the other hand, has been able to keep most of its money in-house. Since the start of 2021, shortly after DFA launched its ETFs in November 2020, through June 2024, DFA saw roughly $80 billion in mutual fund outflows but $82 billion in ETF inflows.
Most Active Equity ETFs Are Struggling
While systematic, quasi-passive ETFs have done well, ETFs that repackage old-fashioned stock-picking have struggled to attract assets. Excluding Dimensional and Avantis, actively managed equity ETFs had roughly $150 billion in assets as of June 2024, a drop in the bucket compared with the more than $8 trillion in actively managed equity mutual funds. Of that $150 billion, at least $20 billion is invested in either “enhanced” indexes or factor-targeting ETFs, both of which are borderline active. So, the true active ETF market is probably closer to $130 billion, which sounds like a lot of money; however, there are multiple mutual funds that have more assets than that individually.
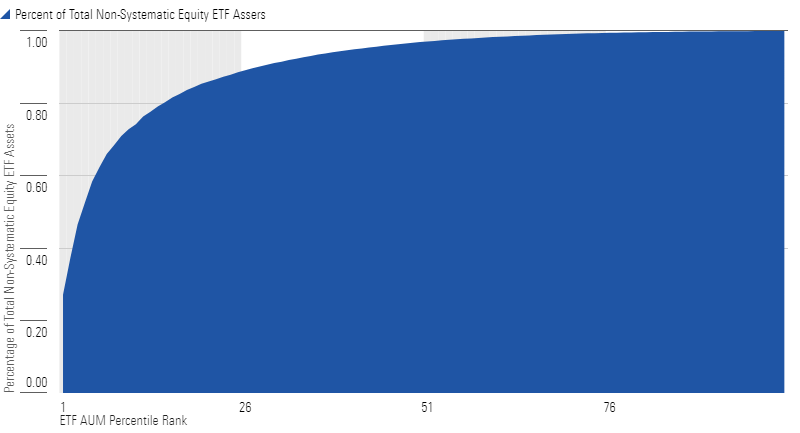
The median old-school active stock-picking ETF held just $48 million in assets and roughly half of them held less than $50 million. The top 20 funds, or less than 4% of the total nonsystematic equity ETFs out there, accounted for half of nonsystematic active equity ETF assets. Further, there are a bunch of ETFs just sitting on the vine, getting no attention. The smallest 50% of active equity ETFs account for just 3% of the group’s total assets, shown below.
Nonsystematic Equity ETF AUM Distribution
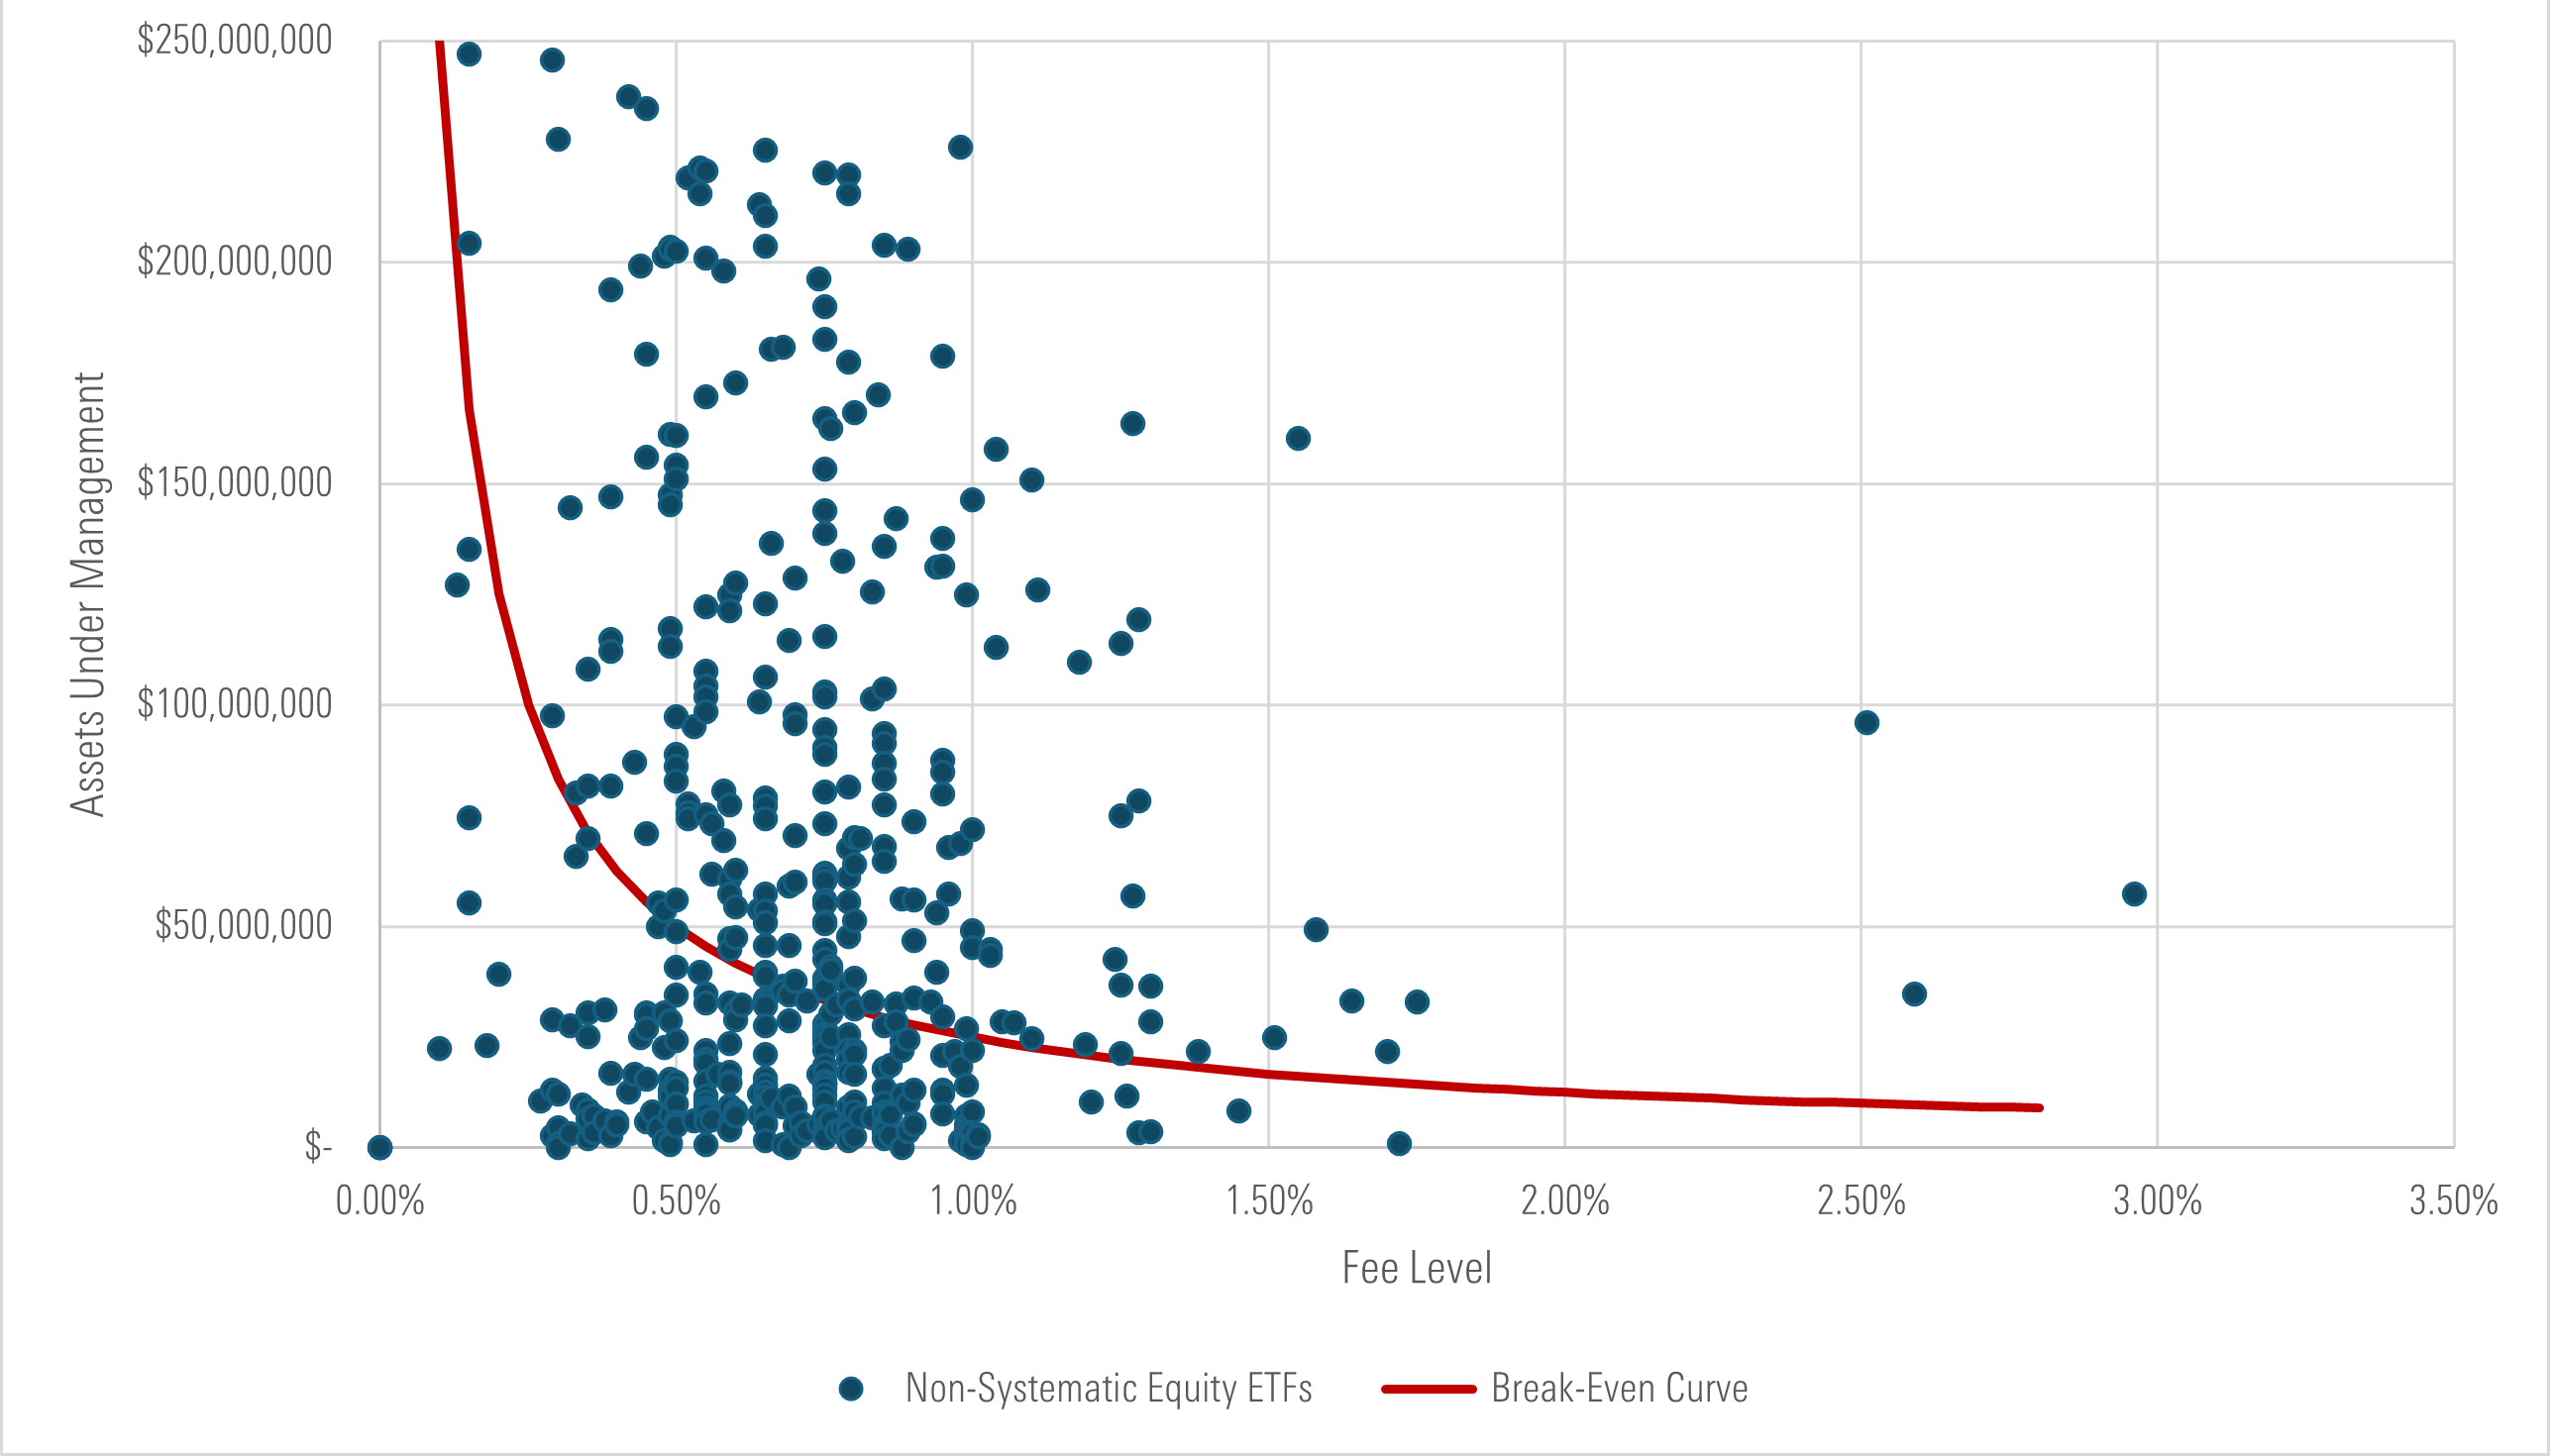
Without attracting more assets, a lot of these ETFs will face liquidation in the near future. ETFs cost money to operate. Beyond the variable costs tied to assets under management, they have fixed costs that they need to cover: things like registration fees, legal and audit fees, exchange listing fees, and trustees’ fees, among others. All told, the amounts can range from a couple hundred to several hundred thousand dollars annually. Assuming the low end, with $250,000 of annual fixed costs, about 42% of nonsystematic active equity ETFs are operating below their breakeven points given the revenue they can generate from their expense ratios, as show below. Any dot underneath the breakeven curve in the below chart represents an ETF that does not have enough AUM to cover $250,000 of annual expenses.
Active ETFs: Breakeven Curve Vs. Actual AUM and Fee Levels
Put another way, there have been more than 190 active equity ETF closures since 2013. In the preceding four quarters prior to their liquidation, those ETFs averaged roughly $20 million in assets. As of September 2024, 30% of nonsystematic active equity ETFs had fewer than $20 million in assets. Either way you look at it, a large chunk of these ETFs likely won’t be around in a couple of years.
All told, it seems unlikely that active ETFs will take off and gain share at the same pace their passive counterparts did in the early 2000s, and there will be plenty of liquidations along the way.
The author or authors do not own shares in any securities mentioned in this article. Find out about Morningstar’s editorial policies.

/d10o6nnig0wrdw.cloudfront.net/09-24-2024/t_c34615412a994d3494385dd68d74e4aa_name_file_960x540_1600_v4_.jpg)
/cloudfront-us-east-1.images.arcpublishing.com/morningstar/T2LGZCEHBZBJJPPKHO7Y4EEKSM.png)
:quality(80)/s3.amazonaws.com/arc-authors/morningstar/b0c51583-b9a2-49eb-9a8f-5f25a8bda4a3.jpg)