
A Crucial Tipping Point for Bond Investors to Keep in Mind
What escape velocity means for a fixed-income portfolio.
/s3.amazonaws.com/arc-authors/morningstar/eda620e2-f7a7-4aef-bb6c-3fb7f1ac7a38.jpg)
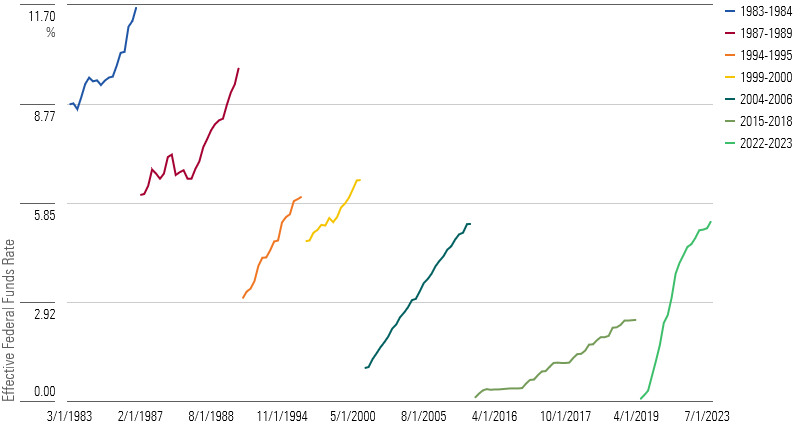
After years of sleepwalking along at modest levels, bond yields and the markets that trade them have jolted awake. Dogged inflation and a surprisingly durable economic recovery have pushed the Federal Reserve to raise interest rates by more than 5 percentage points since the current hiking cycle began 18 months ago, plunging bond markets into uncharted waters.
Rate Hike Cycles, 1983-2023
Investors have been caught in the whipsaw. The 10-Year U.S. Treasury Bond, one of the most closely watched bond benchmarks, has seen its yield spike from 1.7% as of February 2022 to 4.1% as of August 2023—the first time it crossed 4% since the global financial crisis. (Yields rise when prices fall, so the iShares 7-10 Year Treasury Bond ETF IEF lost 14.6% over that stretch.)
There are a few rules of thumb that are helpful for bond investors to take note of when navigating choppy markets like this one. One has laid dormant in the fixed-income markets for nearly 15 years: a concept known as escape velocity. This concept is a useful one but requires dusting off.
What is Escape Velocity?
Higher bond yields realign the risks that investors should emphasize when choosing what bonds to invest in. When yields are low, that means bond prices are not discounted very much relative to the face value of the bond (effectively the amount of the loan). With a lower price cushion, the risk of capital losses—that is, bond prices falling owing to a subsequent rise in market rates—is high. That makes a bond more attuned to shifts in the prevailing interest rate, all else equal.
Duration is a way of expressing this relationship mathematically. It has a few ingredients: the face value of the bond, the coupon rate, the prevailing market interest rate, and years to maturity. By discounting the cash flows back to today, duration gives you an approximate measure of a bond’s sensitivity to interest-rate movements, given its starting yield. A good rule is that you can expect a bond to rise or fall by its modified duration, which is denominated in years, for every 1 percentage point move up or down in interest rates. We can illustrate this concept with a hypothetical $1,000 plain-vanilla bond that matures in 10 years and pays out an annual coupon of 4%.
Rising Yields Mean Lower Durations
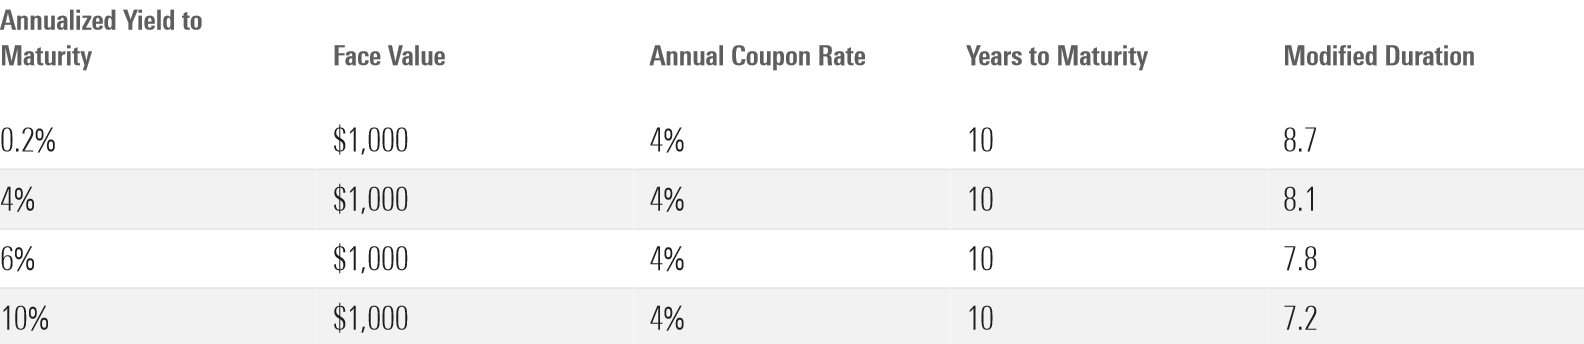
For most of the past 15 years, Treasury bond investors operated in an environment where yield was extremely hard to find—not too dissimilar from the first two rows in this table. As evidenced by the table, lower yields modestly extend a bond’s duration, creating a slightly bumpier ride for bond investors.
In those types of situations, it’s almost always true that a high-quality government bond’s duration is greater than yield to maturity, which means that bond investors can expect a negative nominal return as rates rise. Take the example of a bond priced at par, found in Row 2 in the table above. If rates rise after the bond is bought, the fall in price offsets the coupon and the investor loses money.
Performance of a Hypothetical Bond at 4% Yield to Maturity
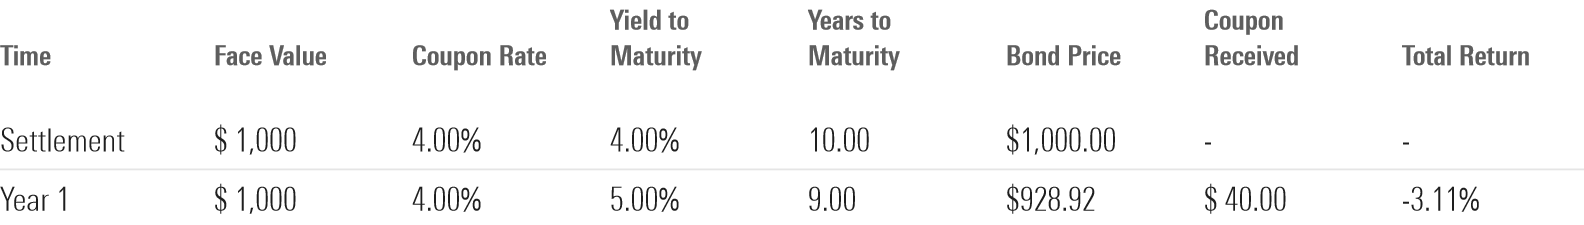
Bummer, right? But as interest rates start to creep up, that no longer has to be the case. The north and south poles of bond investing invert: Yields rise, and bond prices fall. If the conditions are just right, yields can actually overtake duration. That’s where escape velocity comes in, and stuff starts to get really weird.
How Does It Work?
Let’s take the example of the bond in the bottom row of the table above. If rates start at 10% instead of 4%, an investor would pay $631 upfront instead of $1,000. If rates rise by 1 percentage point, the bond’s duration of 7.2 means it will lose roughly 7.2% of its value—not fun. However, an investor still has a margin of safety: $632 is a lot cheaper than $1,000, and they still have the same amount of coupons coming in the door, and time has passed, which brings the investor a year closer to their bond maturing.
Performance of an Identical Bond at 10% Yield to Maturity
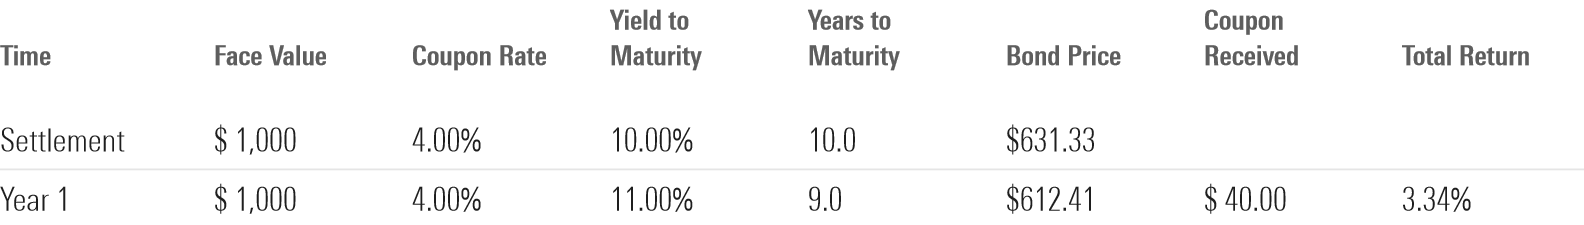
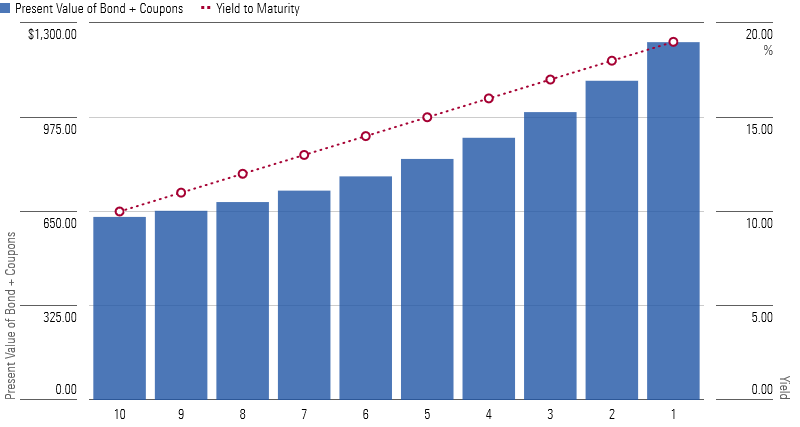
Inclusive of all of those levers, one can expect that over a calendar year the gears of bond math will overturn the initial price decline and an investor will end up with a positive nominal return of 3.3%. This math holds over the entire life of the bond, which means rates can rise to almost 19% and the investor will still end up with a positive return.
Time value of Money Outweighs Rising Yields as a Bond Approaches Maturity
Which Bonds Have Reached Escape Velocity?
It varies from bond to bond, but generally speaking short-term bonds with a duration of less than three years are the only bonds that are currently at escape velocity in aggregate.
Only Short-Term Bonds Have Reached Escape Velocity
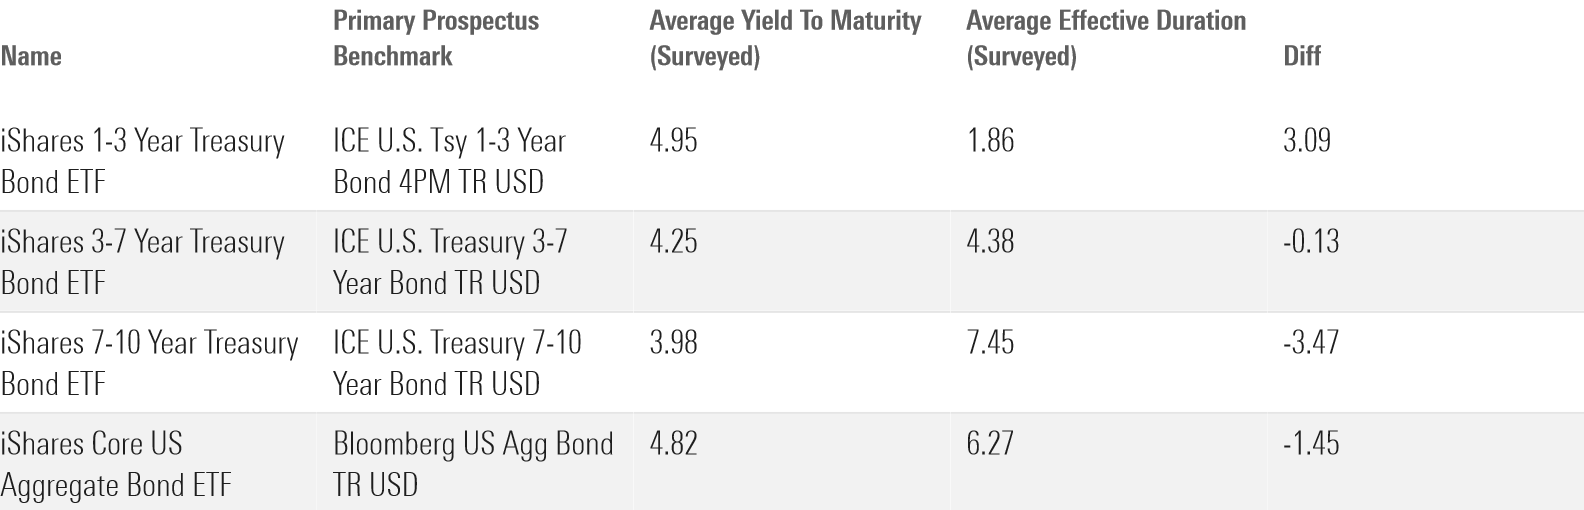
That means that for investors who own bonds in this bucket, the direction of rates generally doesn’t affect the price of their investments enough to outweigh the margin of safety gifted by the time value of money. Investors can make enough for the next several years from the coupons they receive, boosted by the passage of time, that it doesn’t matter quite so much whether the bond market itself is in the red or in the black.
However, it also means that most bond investors are still toeing the line between current bond yields and future interest-rate changes. What can they take away from this tipping point?
Conclusions
In the current interest-rate environment, escape velocity indicates that short-term bonds are on sale. Investors have fled the asset class in droves, hollowing out that bond market segment in favor of a barbell of shorter-term securities like money market funds, which have even higher yields, and bonds with a longer time horizon, which offer more certainty.
It’s not hard to figure out why. Don’t fight the Fed, as the saying goes. John Rekenthaler discussed in his column just yesterday that long-term bonds have merit for investors who are confident that the Fed is close to finished with its current hiking cycle, as it has suggested. Meanwhile, cash-like instruments are going for an even deeper discount than short-term bonds are, providing all the income that some investors need to satisfy near-term goals.
All along the yield curve, investors are bracing for the impact of impending rate cuts. But they are flocking to extremes in the process, and yield curve timing is a complicated art. Escape velocity suggests that there may be some value—or even more surprisingly, some peace of mind—to be had in the messy middle.
3 Top Stocks for the Next 10 Years
The author or authors do not own shares in any securities mentioned in this article. Find out about Morningstar’s editorial policies.
/cloudfront-us-east-1.images.arcpublishing.com/morningstar/HCVXKY35QNVZ4AHAWI2N4JWONA.png)
/cloudfront-us-east-1.images.arcpublishing.com/morningstar/EC7LK4HAG4BRKAYRRDWZ2NF3TY.jpg)
/cloudfront-us-east-1.images.arcpublishing.com/morningstar/ZJTW7PDXFVDWDP7YNYC4UVOHVU.jpg)
:quality(80)/s3.amazonaws.com/arc-authors/morningstar/eda620e2-f7a7-4aef-bb6c-3fb7f1ac7a38.jpg)