
These Energy Stocks Were Left Behind in the Big Rally
Energy stocks more than doubled over the past three years, but Morningstar analysts see a few names with room to run.
/s3.amazonaws.com/arc-authors/morningstar/ba63f047-a5cf-49a2-aa38-61ba5ba0cc9e.jpg)
Energy stocks have been on a tear, rising more than 200% over the past three years as oil prices recovered from multiyear lows.
That’s taken many energy stocks into overpriced territory. On balance, the sector is now fairly valued according to Morningstar analysts.
However, they say pockets of undervalued energy stocks missed out on the biggest gains.
Those opportunities can be found in both industries that generally were among the strongest-performing groups and those that lagged. That includes oil and gas exploration companies whose stock prices tend to move closely with the direction of oil prices, as well as industries with less leverage to higher oil prices, such as pipeline transportation and other so-called midstream companies.
There are four energy stocks in undervalued territory, even with three of them posting gains north of 60% over the past three years:
For investors, the past three years offer a lesson in how energy stocks perform related to significant swings in oil prices, along with the new dynamics of the energy industry, where many companies are now pumping more cash back to stockholders through dividends and spending less money on drilling wells.
“The rebound in oil demand has been much more robust than I think people were expecting,” says Stephen Ellis, equity research strategist for energy at Morningstar. Against that backdrop, “the energy sector’s recent rally has been robust and reflective of improving fundamentals—but not entirely surprising,”
The sector’s rally was primarily driven by a few key factors, according to Ellis: a rebound in demand for oil after coronavirus-related slowdowns that began in 2020; energy supply constraints in 2022 that came in the wake of the Russia-Ukraine war; and energy companies’ improvements in capital allocation practices.
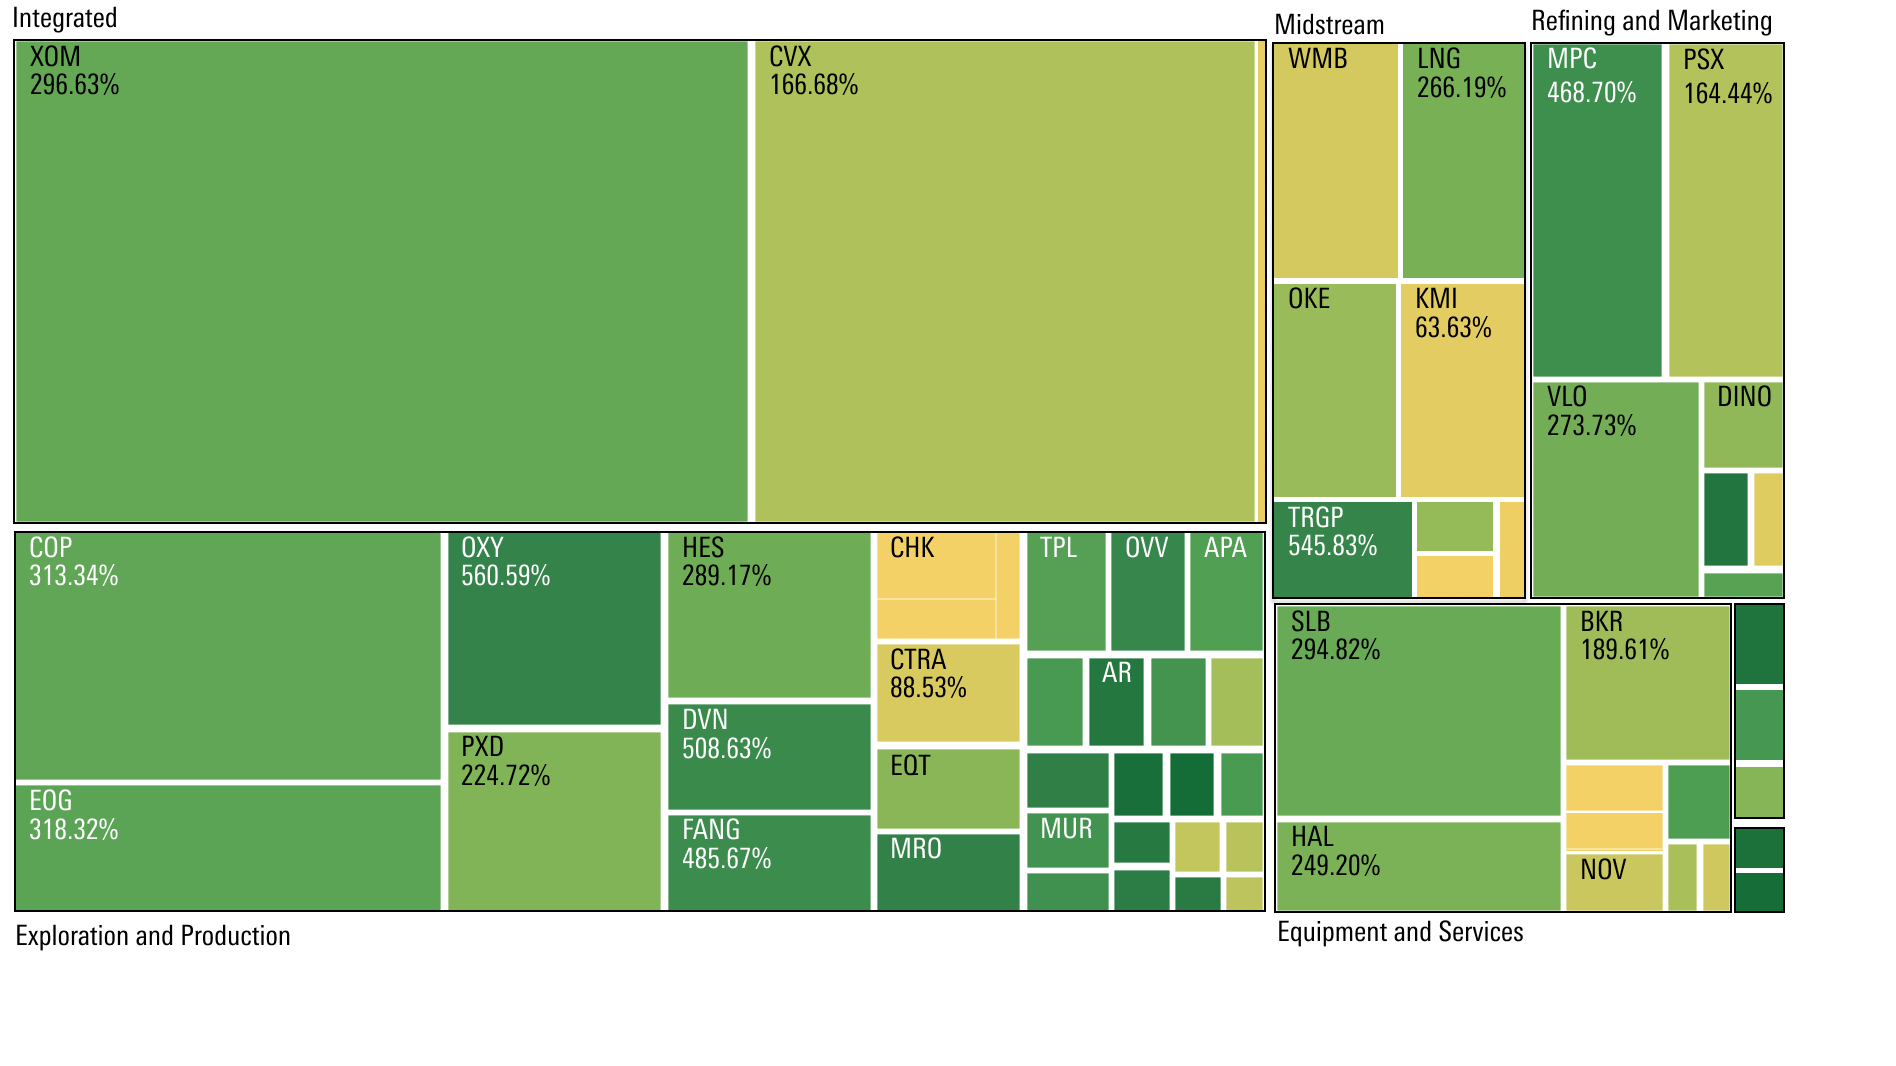
Over the past three years, the Morningstar US Energy Index gained 244.4% through September, while the broader market rose 30.6%, as measured by the Morningstar US Market Index. Heavyweight oil and gas corporations ExxonMobil XOM (up 296.6% over the past three years) and Chevron CVX (up 166.7%) drove returns for the period. Energy stocks across the board made outsize gains that contributed to the rally.
Energy Sector 3-Year Performance
Which Kinds of Energy Stocks Are Most Exposed to Changing Oil Prices?
Energy stocks of all kinds are positively correlated with oil prices, meaning they tend to move in the same direction. This is because their business models rely heavily on the world’s supply and demand of oil.
However, investors shouldn’t treat all energy stocks with the same broad brush when it comes to changes in oil prices.
At the industry level, the types of energy companies with the highest correlations to oil prices are “oil and gas exploration and production”—companies that discover and develop new oil and gas fields—and “oil and gas integrated.” Integrated energy companies are those most likely to be household names, and they are engaged in all or nearly all of the diverse aspects of oil and gas operations (exploration, production, manufacturing, refining, marketing, and transportation), such as ExxonMobil and Chevron.
These two industries each have an average three-year correlation to oil prices of 0.7, as measured against West Texas Intermediate crude, a commonly cited global oil benchmark.
Correlation measures the tendency of different investments to move up or down at the same time. When measuring correlation, a reading of 0 indicates the two investments are moving with no relationship, while 1 means gains or losses in perfect unison. A reading of negative 1 means they uniformly move in the opposite direction. A positive correlation of 0.7 is generally considered strong.
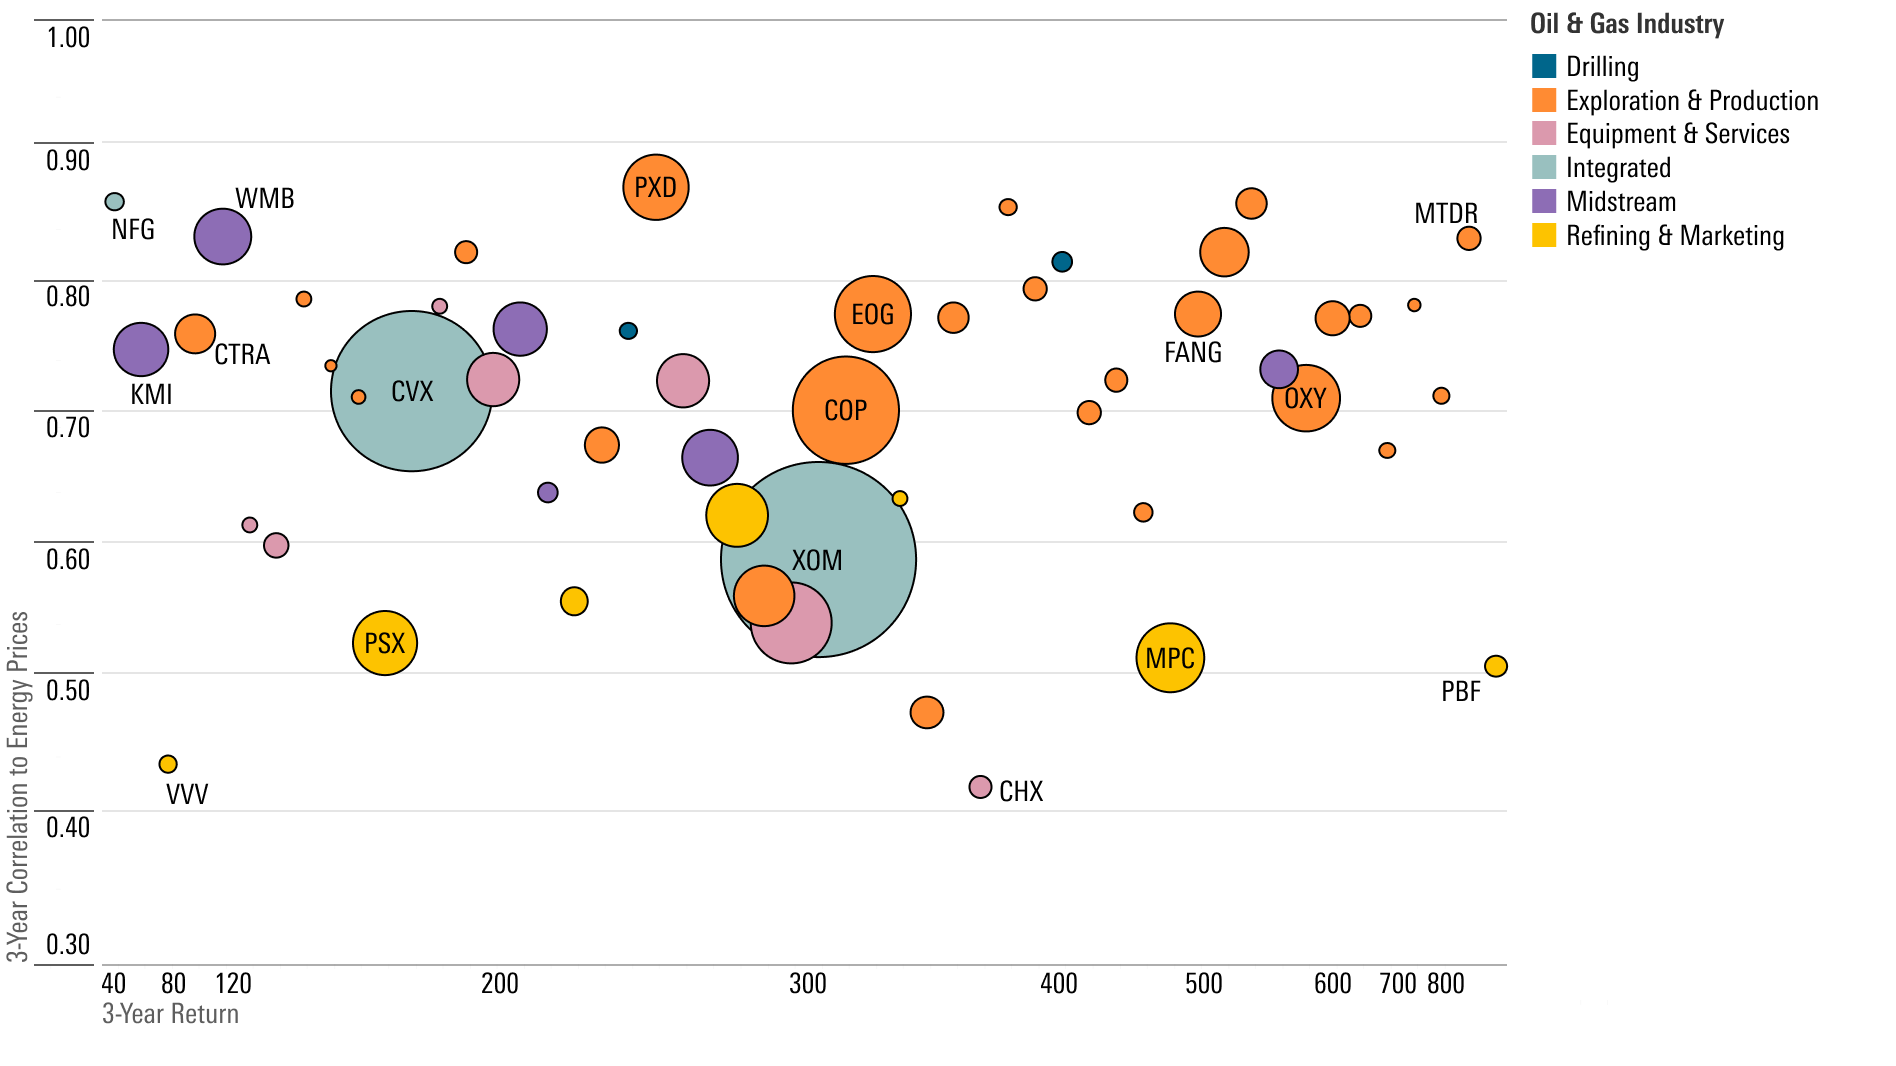
Energy Stock Correlation to Oil Prices, by Industry
“Exploration and production companies are typically the most leveraged to changing oil prices, because oil and gas prices underlay 100% of their business model,” Ellis says. Of course, that means that when oil prices fall, it can be a negative, but “some firms hedge the risk and others don’t.” Ellis says that the more these exploration and production companies hedge against changing oil prices, the more they can give back to shareholders in the form of dividends.
Energy Stocks' Correlation to Oil Prices
Investor-Friendly Energy Stocks
While energy companies have long seen their fortunes tied to the ups and downs of oil prices, one aspect of the business has undergone a significant change in recent years: how they use the piles of cash they rake in during good times.
“Over the past few years, U.S. oil and gas exploration and production companies have really shifted toward returning capital to shareholders in the form of dividends,” Ellis says. "
In prior decades, “oil and gas exploration and production companies wasted hundreds of billions of dollars worldwide—the industry saw significant write-offs,” Ellis says. “Now, there’s been a big improvement in capital allocation, and it represents a big shift for the industry.”
“Instead of spending on new reservoirs and wells, they’re slowing production, lowering their debt ratios, and returning the excess to investors—and that’s driven up the prices of these stocks,” he says.
One way to see this trend at work is to observe the balance sheets of exploration and production companies in the Morningstar US Energy Index and track how their capital allocations have improved over time.
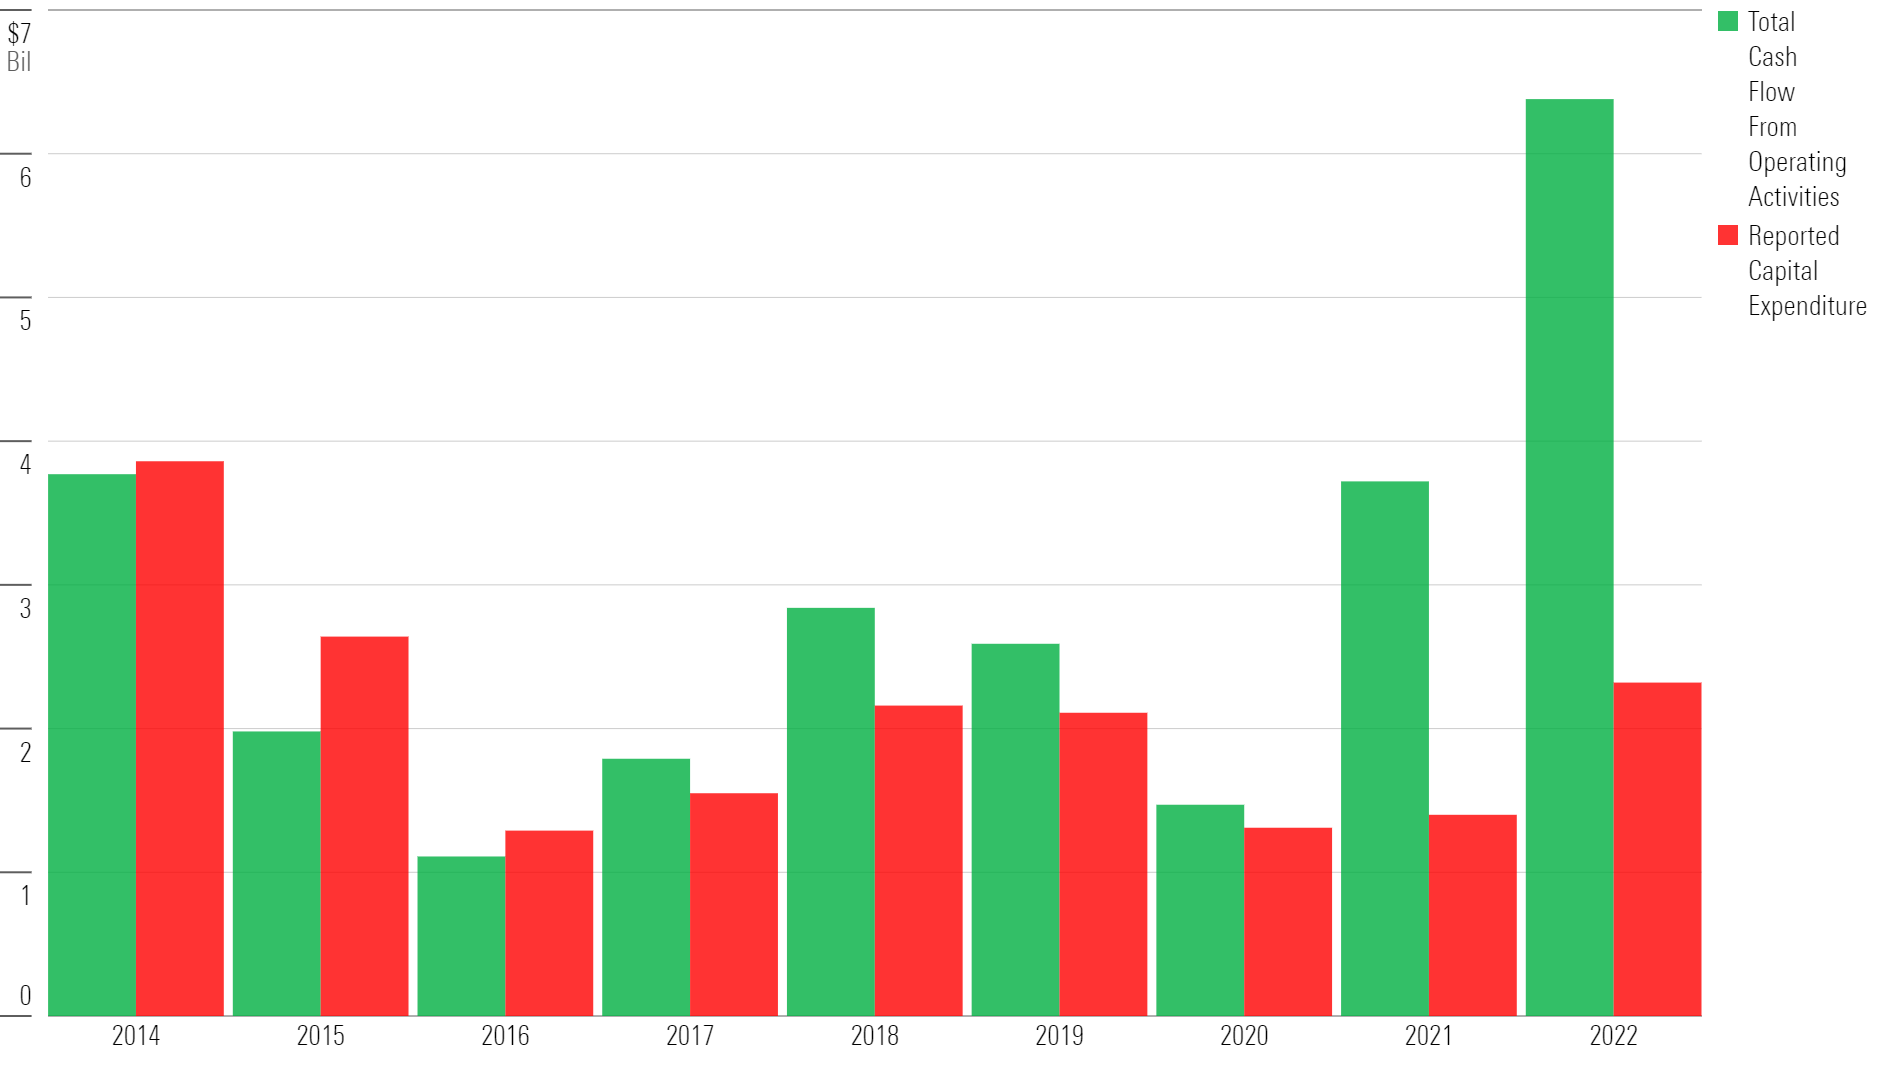
Ten years ago, for example, Devon Energy, Coterra Energy CTRA, and EQT EQT had reported capital expenditures that surpassed their total cash flows, digging themselves into debt in the process.
At Devon Energy, in 2014 and in years prior, the company reported $6.98 billion in capital expenditures and only $6.02 billion in total cash flow from operating activities, according to PitchBook data. Since then, the company has slowly improved its capital allocation, ending 2022 with positive cash flows of more than $5.98 billion.
“Investors are much happier that the companies are investing in a more shareholder-friendly way and reducing uncertainty around what will happen with future profits,” Ellis says.
Capital Allocation of Oil and Gas Exploration and Production Firms
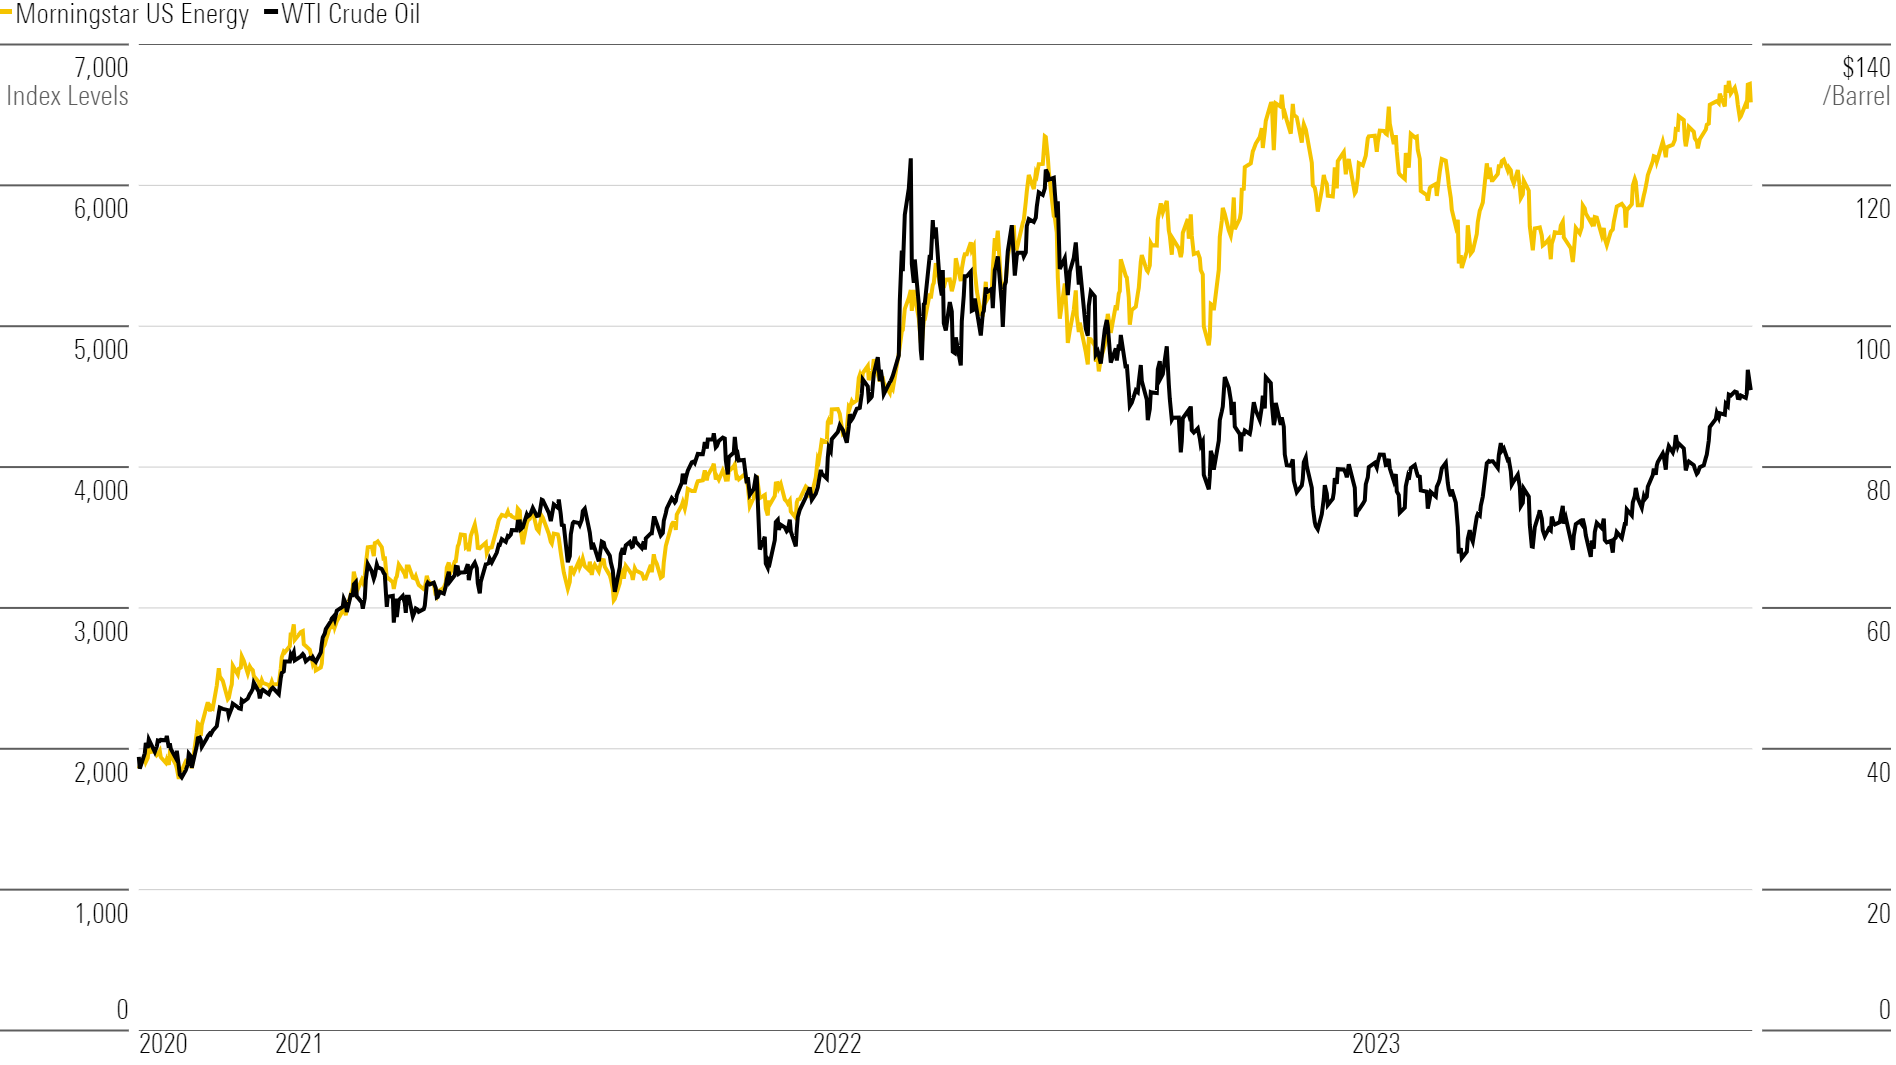
Rising Oil Prices Fuel Energy Stock Rally
However, the primary driver for energy stock performance remains energy prices, and the past few years have seen massive swings in the cost of a barrel of oil.
After the onset of the coronavirus pandemic in March 2020 briefly sent oil prices to negative territory and then hovering near $40 per barrel for the rest of the year, oil prices rebounded to a 14-year peak of $126 per barrel in June 2022. During this time, the Morningstar US Energy Index rose roughly 80%. The index continued rising throughout 2022, outperforming all other Morningstar U.S. sector indexes by a wide margin.
In 2023, the energy index fell 5.4% in the first half of the year alongside falling oil prices, while the Morningstar US Market Index gained 16.5%. Since then, energy stocks have rebounded along with oil prices. Crude-oil prices ended September just above $90 per barrel.
Energy Stocks and Oil Prices
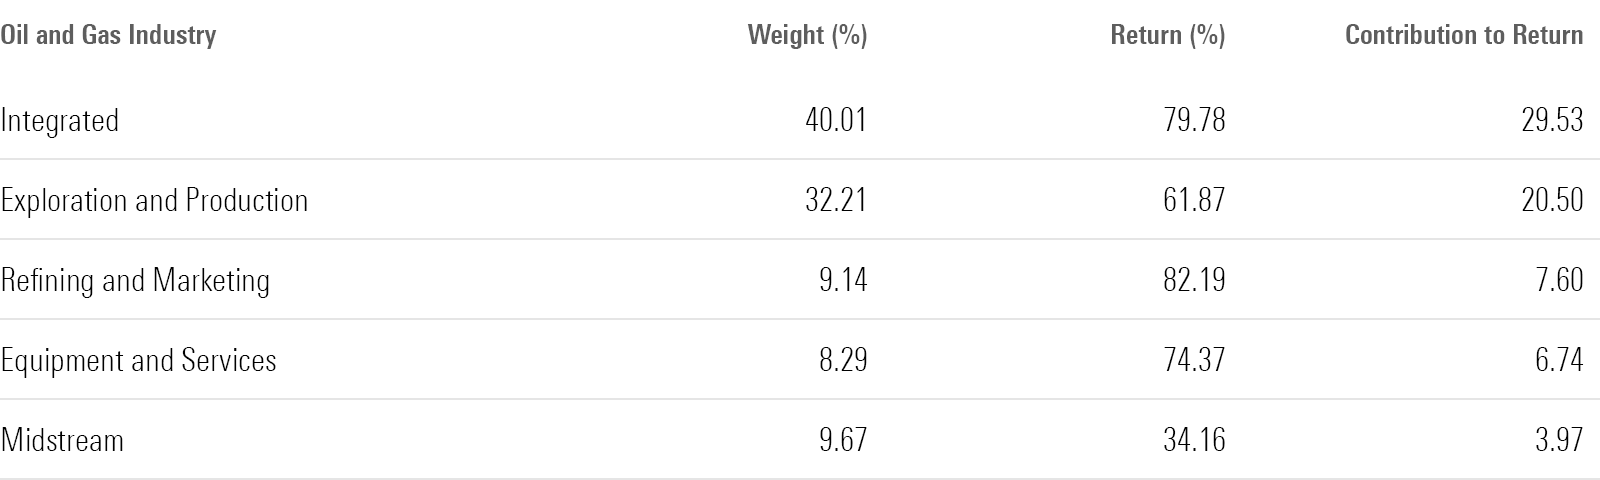
Which Stocks Contributed Most to the Rally?
Against this backdrop, the leading contributors to the Morningstar US Energy Index over the past three years were well-diversified energy giants ExxonMobil (up 55.2% per year annualized) and Chevron (up 37.1% per year annualized). These are the two largest stocks in the energy index as of Sept. 30.
The third-largest contributor for the three-year period was hydrocarbon exploration and production company ConocoPhillips COP, which rose 58.4% per year annualized. Next was petroleum refining and marketing firm Marathon MRO, up 75.6% annualized per year for the same period.
Energy Sector - Contributing Industries
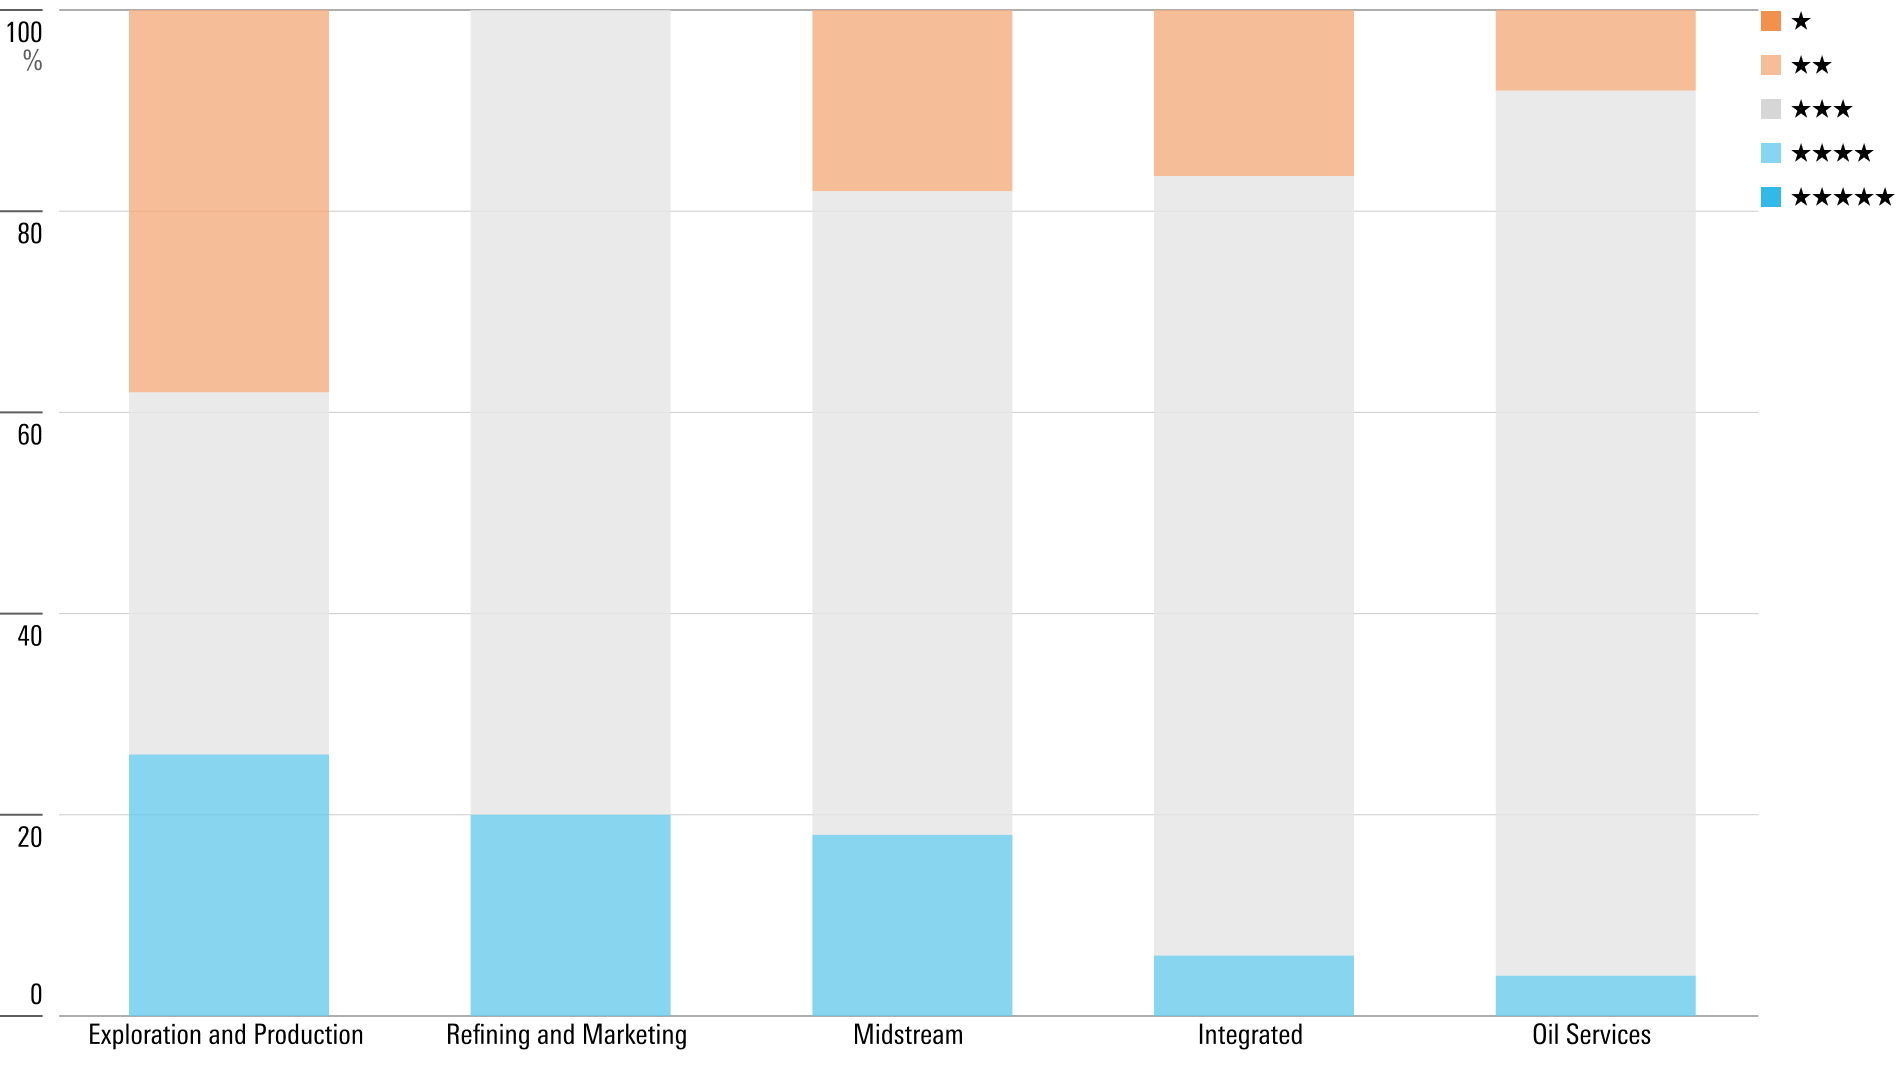
Energy Stocks Are Fairly Valued Overall
For now, Morningstar equity analysts see the sector fairly valued as a group. The Morningstar US Energy Index’s weighted-average price/fair value ratio lies at 1.02 as of Sept. 30, implying that the median stock is 2% overvalued.
Energy valuations are down from their November 2022 peak median price/fair value ratio of 1.14 (implying the median stock was 14% overvalued). Until then, sector valuations were rising from deep discounts after oil prices plummeted to negative territory in spring 2020 amid global pandemic lockdowns.
Energy Sector Valuations by Industry
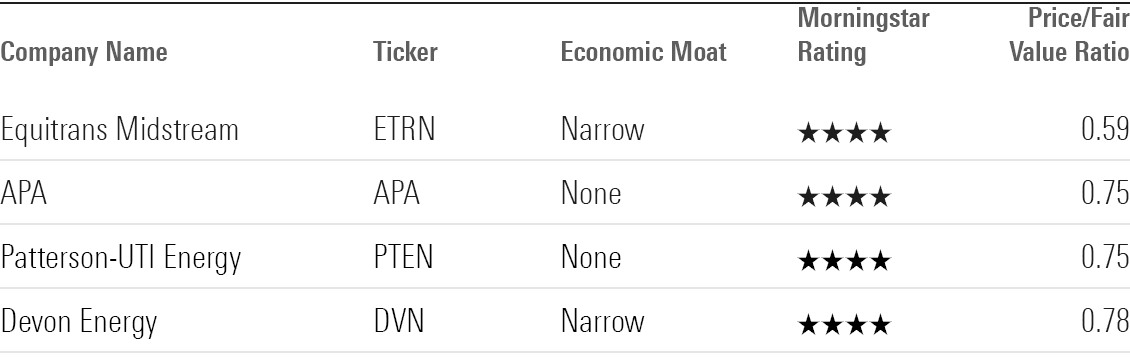
Undervalued Energy Stocks That Lagged the Rally
To find the few energy stocks that are still undervalued, we screened the Morningstar US Energy Index for names that carried a Morningstar Rating of 4- or 5-stars. Of the 64 stocks in the index, Morningstar analysts cover 31. Just four of these stocks were undervalued as of Oct. 25.
The most undervalued company on the list is natural gas pipeline company Equitrans Midstream, trading at a 41% discount to its fair value estimate. The least undervalued is Devon Energy, trading at a 22% discount.
Equitrans Midstream and hydrocarbon exploration firm Devon Energy both earn a Morningstar Economic Moat Rating of narrow, a signal of the ability to fend off competition and earn high returns on capital for many years to come. Historically, undervalued stocks with moats perform better over time than less profitable and more indebted counterparts. They also tend to protect against downturns and be less risky than lower-quality stocks. Neither APA nor Patterson-UTI Energy has earned an economic moat.
Undervalued Energy Stocks
Equitrans Midstream
- Industry: Midstream
- Fair Value Estimate: $15.00
“We award Equitrans a narrow moat rating based on efficient scale. We think Equitrans has one of the higher-quality revenue mixes in our coverage, as over 50% of its revenue comes from firm fixed-fee contracts that are take-or-pay with average lengths of about 12-13 years. The eventual completion of the Mountain Valley Pipeline and related efforts (Hammerhead, MVP Southgate, MVP Expansions) should boost EBITDA by 30% and increase the revenue associated with firm reservation contracts to over 70%.”
—Stephen Ellis, sector strategist
APA
- Industry: Exploration and Production
- Fair Value Estimate: $55.00
“APA has historically struggled to meet the threshold for a moat rating by consistently failing to earn its cost of capital. However, it apparently turned the corner in 2021, and our projections now show modest excess returns on invested capital over the next decade. But there’s a catch. Commodity prices soared in 2021 and 2022, providing a temporary advantage, and it will be a lot harder for APA to squeeze economic profits from its legacy assets under midcycle conditions ($55/barrel West Texas Intermediate and $3.30/thousand cubic feet natural gas). It is the contribution from its Suriname position that makes APA look moaty in future years. But this is still a highly speculative asset, with a handful of discoveries but no developments yet sanctioned.”
—Stephen Ellis, sector strategist
Patterson-UTI Energy
- Industry: Drilling
- Fair Value Estimate: $18.00
“We assign no moat to Patterson-UTI. The firm hasn’t historically generated excess returns on capital from its existing operations in contract drilling and pressure pumping (together accounting for 90% of the business), and we don’t expect excess returns moving forward. Opportunities for a moat would likely derive from cost advantages, but we believe commoditization in the rig market coupled with industry cyclicality prevent Patterson from achieving superior operational efficiency relative to its competitors. All three of the end markets in which Patterson operates exhibit a high degree of competition. Available equipment frequently exceeds demand (especially during downturns), and firms’ ability to move said equipment from place to place allows them to follow demand.”
—Katherine Olexa, analyst
Devon Energy
- Industry: Exploration and Production
- Fair Value Estimate: $61.00
“Devon has an inherent cost advantage baked into its asset portfolio (Rystad Energy ranks Devon first among U.S. E&Ps on breakeven costs associated with undeveloped reserves, ahead of several narrow-moat firms such as Diamondback Energy and EOG Resources). This enables the company to reliably deliver excess returns on invested capital, which are a hallmark of moaty companies in our framework. We therefore assign a narrow moat rating.”
—Katherine Olexa, analyst
The author or authors own shares in one or more securities mentioned in this article. Find out about Morningstar’s editorial policies.
/cloudfront-us-east-1.images.arcpublishing.com/morningstar/KIQMCCUZ2RGWZKSCKM2Z4ZULFU.png)
/cloudfront-us-east-1.images.arcpublishing.com/morningstar/MGEDEFIRZJFHTAFNLDHG46SDXI.png)
/cloudfront-us-east-1.images.arcpublishing.com/morningstar/6HLXVGQ6DFCQDC3WHBZC6TLS2U.png)
:quality(80)/s3.amazonaws.com/arc-authors/morningstar/ba63f047-a5cf-49a2-aa38-61ba5ba0cc9e.jpg)