
Unwrapping the ETF Wrapper
Where the ETF structure shines and where it falls short.
/s3.amazonaws.com/arc-authors/morningstar/5db00d6b-9c2f-4da7-8f94-da4290cf3b4a.jpg)

The innovative structure of exchange-traded funds is helping to democratize investing.
With no minimum investment required and low, or no, fees to buy an ETF, the barrier to get started has never been lower. ETFs have grown to represent almost 30% of U.S. fund assets and helped lower the average fund fee by 63% since their birth more than 30 years ago (1).
ETFs Continue to Steal Market Share
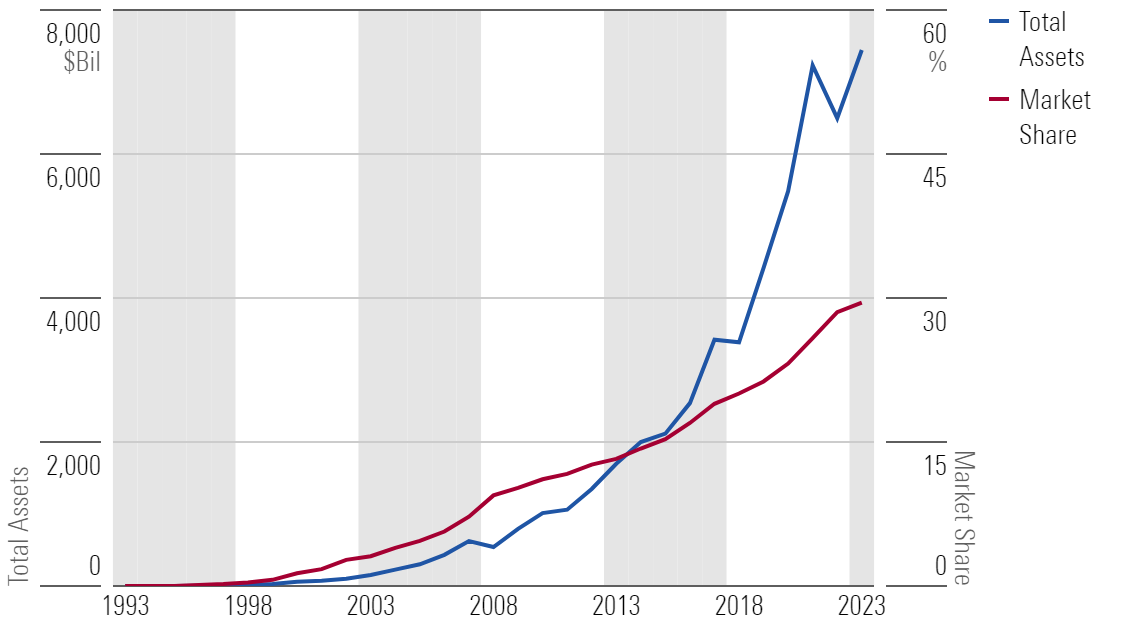
The ETF structure works especially well in a few areas. Diversified index-tracking strategies offer any investor with a brokerage account access to thousands of stocks for just a few dollars and at a low fee. Their low-cost proposition, coupled with accessibility, tradability, and transparency, allowed ETFs—a large proportion of which are index ETFs—to make a sizable dent in a U.S. fund market dominated by mutual funds.
These unique features, while appealing, do not make ETFs a silver bullet. ETF investors should exercise caution in certain categories because nuances in the structure and ETF-specific liquidity don’t suit some markets.
Where the ETF Structure Shines
The below table illustrates some of the key differences between ETFs and mutual funds. Many of these differences helped ETFs gain traction with retail investors, who typically lack the means to access the cheapest mutual fund share classes.
| ETF | Mutual Fund | |
|---|---|---|
| Tradability | Traded throughout the day on public exchanges | Bought and sold through fund company at designated times |
| Average Fee (1) | 0.17% | 0.44% |
| Sales Charge | No sales charge | Can incur sales charge |
| Pricing | Priced continuously throughout the trading day | Priced only at end of day |
| Minimum Investment | No minimum | Can have minimums of a few hundred dollars to millions for some share classes |
| Transparency | Required to disclose holdings daily (2) | Required to disclose holdings quarterly |
| Capital Gains Distributions | Ability to purge low-cost-basis securities in-kind, insulating ETFs from most capital gains distributions (3) | Must trade the fund’s inflows and outflows, which can result in capital gains distributions |
(1) Asset-weighted average fee. Source: Morningstar Direct. Data as of Aug. 31, 2023.
(2) Semitransparent ETFs are the lone exception, although they make up a very small segment of the ETF market.
(3) Vanguard ETFs can incur capital gains distributions in rare cases because they are uniquely structured as a share class of their mutual funds.
Diversified stock strategies work best in the ETF wrapper. Products tracking liquid markets, like large-cap U.S. equities, typically charge mere basis points and consistently give investors representative exposure to that asset class. Where they differentiate themselves from index funds is that they can purge their portfolio of low-cost-basis securities through the creation/redemption process, making them more tax-efficient. Some highly rated equity index ETFs include SPDR Portfolio S&P 500 ETF SPLG, iShares Russell 1000 ETF IWB, and Vanguard Total Stock Market ETF VTI. Superior diversification, a minuscule price tag, and the ability to track their benchmark to near perfection make any of these ETFs an easy choice for investors.
Where the ETF Structure Falls Short
The emergence of ETFs has certainly been a net positive for investors, but its structure can constrain strategies that delve into niche markets. For example, bond ETFs that cover illiquid markets, like municipal bonds, high-yield bonds, or bank loans, can saddle investors with unseen costs that erode returns and mitigate those strategies’ diversifying benefits.
Many municipal bonds trade hands on rare occasion, while bank loans or some high-yield bonds trade even more infrequently. As a byproduct of illiquidity, the price of an underlying bond can vary tremendously from transaction to transaction, making it difficult to estimate the portfolio’s fair value in the interim. This presents a major challenge for market makers who rely on estimates to price the ETF and maintain bids and offers throughout the day. Mutual funds skirt this issue by only pricing their shares at the end of the day. ETFs, meanwhile, must always remain transactable.
Market makers’ struggle to price ETFs in illiquid markets results in wide bid-ask spreads. The bid-ask spread is the difference between the price at which a participant is willing to buy an ETF (the bid) and the price at which a participant is willing to sell an ETF (the ask). The theoretical value of the fund is usually somewhere in the middle.
The table below illustrates the liquidity challenges in some U.S. fixed-income categories, relative to more liquid ones, as proxied by the daily average spread as a percentage of fund price—comparing with fund price is critical because a pennywide spread for a fund priced at $1 is 100 times as costly for investors to trade compared with a fund priced at $100 (1% versus 0.01%). Retail investors are more likely to receive an unfavorable price when buying or selling an ETF with a higher spread. Over time, and if traded often, this can erode returns and deliver unexpectedly poor performance.
Investors should be cautious when buying or selling ETFs in illiquid categories. The table below shows the daily average spread for five bond categories over the last year.
| Morningstar Category | Daily Average Spread (Trailing 12 Months) |
|---|---|
| Short Government | 0.10% |
| Intermediate Core Bond | 0.44% |
| Municipal National Intermediate | 0.57% |
| High-Yield Bond | 0.77% |
| Bank Loan | 1.20% |
Source: Morningstar Direct. Data as of Sept. 30, 2023.
Short-term government-bond ETFs unsurprisingly have the narrowest spread at 10 basis points on average during the last 12 months. U.S. Treasuries trade all the time and in huge quantities, ensuring ETFs following their moves remain accurately priced. Next up is the intermediate core bond category. It also consists largely of U.S. Treasuries but weaves in some high-quality corporate bonds and securitized products—most of which still trade somewhat frequently.
Municipal bonds, high-yield bonds, and bank loans are where investors are most likely to suffer for choosing an ETF. The daily average spread in each category is 0.57% or higher, with the spreads of bank-loan ETFs fluctuating substantially over the past 12 months. Depending on how frequently investors buy and sell these ETFs, trading costs may take a big bite out of their performance.
Bond ETFs also don’t take much advantage of the ETF’s best feature: tax efficiency. Bond ETFs pay out a high percentage of their total return in interest income instead of capital gains, like equities. No amount of in-kind creations or redemptions can wash away the tax liability of interest, neutralizing the ETF structure’s greatest feature.
Proceed With Caution
Trading costs can be harmful in illiquid categories, but that doesn’t mean investors should avoid ETFs altogether. Instead, they should exercise caution when selecting an ETF in such categories. Some ETFs are more liquid than others, effectively minimizing their bid-ask spreads and associated trading costs for investors. Large ETFs with longer track records are typically much more investor-friendly than newer and relatively small products.
IShares National Muni Bond ETF MUB and SPDR Blackstone Senior Loan ETF SRLN boast the most assets of any ETF in their respective category and claim the tightest daily average spread. IShares iBoxx $ High Yield Corporate Bond ETF HYG is the largest ETF in the high-yield category and enjoys the second-tightest spread.
In categories featuring liquid assets, like large-cap U.S. equities, investors can afford to prioritize the strategy of the ETF itself and not worry as much about trading costs. In those markets, the ETF’s underlying assets are regularly priced and easy to buy or sell for market makers, thus spreads tend to be tighter.
In the fixed-income categories discussed and others like them, investors should have a sharper eye. These investors may be more susceptible to unseen costs resulting from the pricing and trading requirements of the ETF wrapper. They should closely evaluate the strategy and its trading characteristics.
A great strategy is worth little if purchased for a bad price.
5 High-Yield Bond ETFs With the Lowest Daily Average Spread
| Investment | Ticker | Fund Size ($Mil) | Fee (%) | Spread | Medalist Rating |
|---|---|---|---|---|---|
| SPDR Bloomberg High Yield Bond ETF | JNK | 6,049 | 0.40 | 0.01% | Neutral |
| iShares iBoxx $ High Yield Corporate Bond ETF | HYG | 12,262 | 0.49 | 0.01% | Neutral |
| iShares 0-5 Year High Yield Corporate Bond ETF | SHYG | 4,718 | 0.30 | 0.03% | Gold |
| Xtrackers USD High Yield Corporate Bond ETF | HYLB | 3,239 | 0.15 | 0.03% | Neutral |
| iShares Broad USD High Yield Corporate Bond ETF | USHY | 8,767 | 0.15 | 0.03% | Bronze |
Source: Morningstar Direct. Spread data from Oct. 1, 2022, though Sept. 30, 2023.
5 Muni National Intermediate Bond ETFs With the Lowest Daily Average Spread
| Investment | Ticker | Fund Size ($Mil) | Fee (%) | Spread | Medalist Rating |
|---|---|---|---|---|---|
| iShares National Muni Bond ETF | MUB | 34,595 | 0.07 | 0.01% | Silver |
| Vanguard Tax-Exempt Bond ETF | VTEB | 27,016 | 0.05 | 0.02% | Gold |
| Pimco Intermediate Municipal Bond Active ETF | MUNI | 1,015 | 0.35 | 0.07% | Neutral |
| JPMorgan Municipal ETF | JMUB | 674 | 0.18 | 0.07% | Silver |
| First Trust Managed Municipal ETF | FMB | 1,812 | 0.65 | 0.07% | Neutral |
Source: Morningstar Direct. Spread data from Oct. 1, 2022, though Sept. 30, 2023.
5 Bank Loan ETFs With the Lowest Daily Average Spread
| Investment | Ticker | Fund Size ($Mil) | Fee (%) | Spread | Medalist Rating |
|---|---|---|---|---|---|
| SPDR Blackstone Senior Loan ETF | SRLN | 4,153 | 0.70 | 0.05% | Neutral |
| Invesco Senior Loan ETF | BKLN | 4,434 | 0.65 | 0.06% | Neutral |
| First Trust Senior Loan ETF | FTSL | 2,188 | 0.86 | 0.10% | Neutral |
| PGIM Floating Rate Income ETF | PFRL | 45 | 0.72 | 0.13% | Neutral |
| Franklin Senior Loan ETF | FLBL | 234 | 0.45 | 0.17% | Neutral |
Source: Morningstar Direct. Spread data from Oct. 1, 2022, though Sept. 30, 2023.
(1) Asset-weighted average fee. Source: Morningstar Direct. Data as of Aug. 31, 2023.
4 Big Dividend ETF Upgrades in 2023
The author or authors do not own shares in any securities mentioned in this article. Find out about Morningstar’s editorial policies.
/cloudfront-us-east-1.images.arcpublishing.com/morningstar/EGA35LGTJFBVTDK3OCMQCHW7XQ.png)
/cloudfront-us-east-1.images.arcpublishing.com/morningstar/ZHTKX3QAYCHPXKWRA6SEOUGCK4.png)
/d10o6nnig0wrdw.cloudfront.net/05-13-2024/t_4a71dba80d824d828e4552252136df22_name_file_960x540_1600_v4_.jpg)
:quality(80)/s3.amazonaws.com/arc-authors/morningstar/5db00d6b-9c2f-4da7-8f94-da4290cf3b4a.jpg)