
Should You Fix the 60/40 Portfolio’s Fixed-Income Sleeve?
Examining common attempts at improving the bond allocation in a balanced portfolio.
/s3.amazonaws.com/arc-authors/morningstar/c00554e5-8c4c-4ca5-afc8-d2630eab0b0a.jpg)

The classic core bond funds used in many balanced portfolios—typically benchmarked against the Bloomberg U.S. Aggregate Bond Index—focus only on U.S. investment-grade bonds. Many have argued for a broader slice of the market in the bond sleeve, whether to improve diversification or to increase returns. In this article, I will examine two sectors that investors commonly reach for when trying to fix the bond sleeve of a traditional 60/40 portfolio: high-yield bonds and international bonds.
The exhibit below displays the performance of hypothetical 60/40 portfolios that reallocate some of their assets from U.S. investment-grade bonds to high-yield and international bonds. The equity sleeve consists of the S&P U.S. Total Market Index (saving the equity home-bias conversation for another day).
Performance of Portfolios With Adjusted Bond Sleeve Relative to the Traditional 60/40 Portfolio
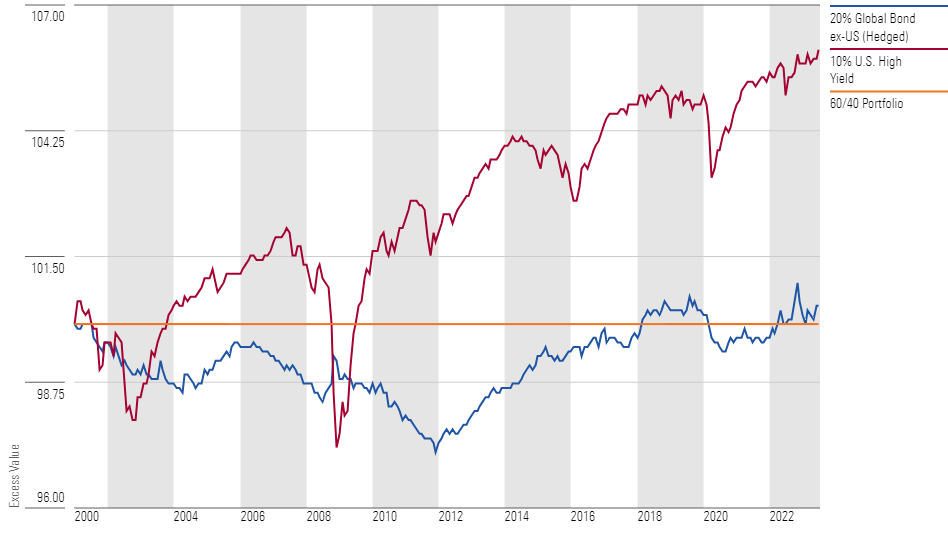
Grass Is Not That Green on the Other Side
The blue line traces a portfolio that allocates 20% to The Aggregate Index and 20% to the index underpinning USD-hedged iShares Core International Aggregate Bond ETF IAGG. This index holds investment-grade debt from both developed and emerging markets but significantly tilts its portfolio toward the former. In theory, exposure to a broad swath of global macroeconomic conditions should provide some diversification benefit.
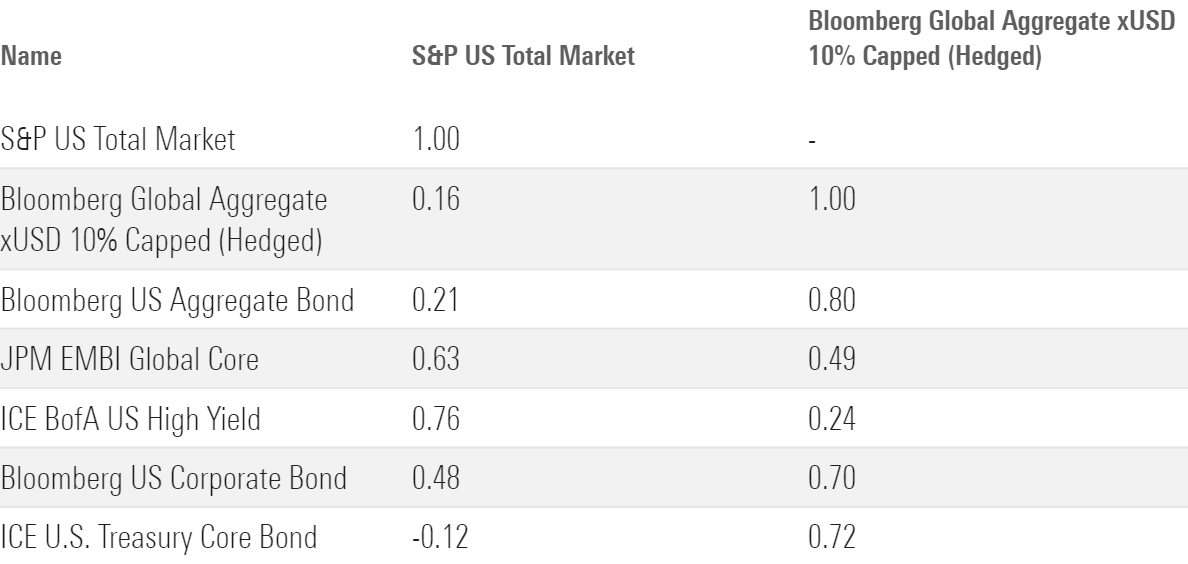
The next exhibit displays the historical correlation of indexes representing major bond sectors and the U.S. total stock market. After Treasuries, international bonds carried the lowest correlation to the U.S. stock market over the period. In addition, broad-market international indexes tend to favor sovereign bonds from developed economies, which can act as a ballast during turmoil coming from the U.S. or soften the impact from emerging-markets troubles.
Correlation Between Major Bond Sectors and the U.S. Stock Market
In practice, the advantages are less clear-cut. On one hand, the international bond portfolio outpaced the 60/40 portfolio by a small margin during some major economic shocks. This includes when U.S. bond yields spiked in the 2013 taper tantrum or when plummeting commodity prices led to wider credit spreads in late 2015. Despite the turbulent bond market in Europe, it also outperformed the 60/40 portfolio by 45 basis points during the global meltdown in 2022.
On the other hand, a strengthening U.S. dollar made international bonds look less attractive than their U.S. counterparts. Investors also faced negative real yields in many corners of the globe, which weighed on performance. International bonds often lagged U.S. bonds during rallies, especially those from developed-markets issuers such as in Japan or the eurozone.
Overall, the downside protection afforded by international bonds did not lead to long-term outperformance and did little to curb the overall portfolio’s volatility, despite a 20% allocation. From January 2001 through June 2023, the international bond portfolio eked out a meager advantage of 2 basis points annualized over the traditional 60/40 portfolio, with similar volatility. International yields are finally rising, which is a promising sign. But overcoming sluggish economic growth will be the real litmus test for these securities.
A Dash of Credit Risk
The high-yield bond portfolio had a slightly better yet more volatile run during this period. It reallocated 10% of the traditional 60/40 portfolio from The Aggregate Index to the ICE BofA U.S. High Yield Index. This index underpins SPDR Portfolio High Yield Bond ETF SPHY, while an issuer-constrained version underpins iShares Broad USD High Yield Corporate Bond ETF USHY.
High-yield bond performance sits somewhere between stocks and investment-grade bonds, as demonstrated by its historical correlation to stocks of 0.7 to 0.8. Allocating to high-yield bonds adds incremental returns to the portfolio while maintaining the more measured payout profile of fixed income. Investors seeking slightly more moderated returns and volatility can look to this portfolio.
This is still a bumpy ride, however. Between January 2001 and June 2023, the standard deviation of its returns was 10.25%, 62 basis points higher than the traditional 60/40 portfolio. The exhibit below compares the standard deviation of the high-yield portfolio to a traditional 60/40 and 70/30 portfolio, on a rolling three-year basis. While the 10% high-yield bond stake did not bring as much volatility as adding an additional 10% equity stake, it still was markedly more volatile than the traditional core bond allocation, especially during periods of market stress. During major credit shocks, this portfolio lagged its higher-quality counterpart. It trailed the 60/40 portfolio by 2.81 and 1.90 percentage points during the trough of the 2008 financial crisis and 2020 coronavirus shock, respectively.
Rolling Three-Year Standard Deviation of Monthly Returns
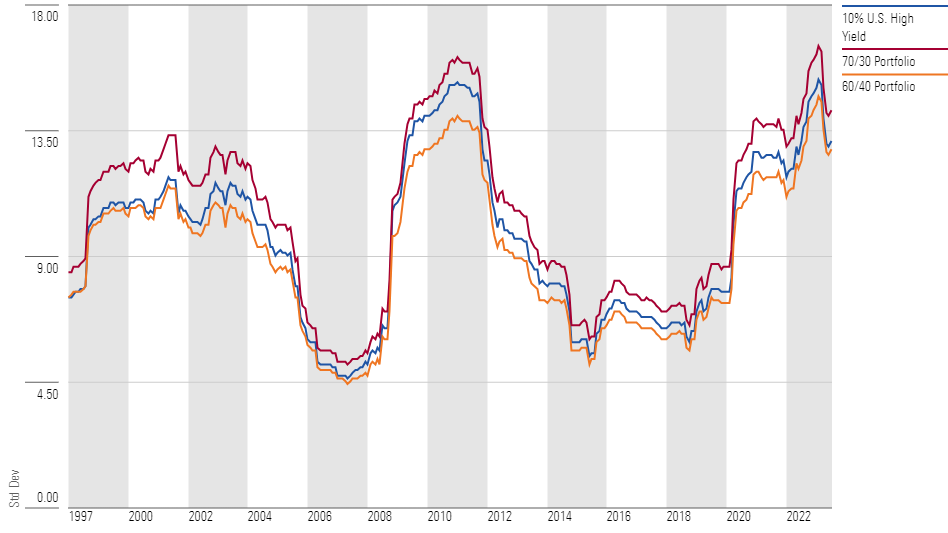
Investors who could stomach the additional volatility found solace in better performance during credit rallies. For instance, the 10% high-yield portfolio beat the 60/40 by 3.40 percentage points when markets recovered from the initial COVID-19 shock between late March through December 2020, and by 2.23 percentage points when spreads rapidly compressed in the first five months of 2009. Between January 2001 and June 2023, the high-yield portfolio outperformed the 60/40 portfolio by 28 basis points annualized. Allocating the 10% to the equity sleeve—and creating a 70/30 portfolio—would result in an annual excess return of 36 basis points over the same period, with a standard deviation of 11.10.
Sizing the allocation to high-yield bonds is another important consideration. The next exhibit displays the risk/reward profile of portfolios with varying allocations to high-yield bonds alongside the 60/40 and 70/30 portfolio, over a nearly 30-year period ended June 2023. Building on returns requires taking on additional risk. The high-yield allocation provides a more granular step-up than increasing the equity portion of the portfolio.
Risk/Reward Profile from January 1995 to June 2023 for Different Allocations of High-Yield Bonds.

Hindsight Is 20/20
While these sectors may provide marginal improvements under certain market conditions, there were also times they did not. Much of the debate over the components of the 60/40′s fixed-income sleeve were sparked after investment-grade bonds performed poorly. Nonetheless, making these adjustments is easier said than done. Adding high-yield or international bonds to the portfolio means making an active bet against the time-tested 60/40 allocation and increasing the margin for error. These substitutes for U.S. investment-grade bonds are not for everyone. Investors should consider their risk tolerance and time horizon when contemplating these changes.
The author or authors do not own shares in any securities mentioned in this article. Find out about Morningstar’s editorial policies.
/cloudfront-us-east-1.images.arcpublishing.com/morningstar/EGA35LGTJFBVTDK3OCMQCHW7XQ.png)
/cloudfront-us-east-1.images.arcpublishing.com/morningstar/ZHTKX3QAYCHPXKWRA6SEOUGCK4.png)
/d10o6nnig0wrdw.cloudfront.net/05-13-2024/t_4a71dba80d824d828e4552252136df22_name_file_960x540_1600_v4_.jpg)
:quality(80)/s3.amazonaws.com/arc-authors/morningstar/c00554e5-8c4c-4ca5-afc8-d2630eab0b0a.jpg)