
8 Observations on ETF Flows in August
Key takeaways after performance cooled down last month.
/s3.amazonaws.com/arc-authors/morningstar/30e2fda6-bf21-4e54-9e50-831a2bcccd80.jpg)

Key Takeaways
- The Morningstar Global Markets Index shed 2.81% in August, and the Morningstar US Core Bond Index finished 0.63% lower than where it started.
- U.S. exchange-traded funds collected $11.7 billion in August, a mild sum that’s congruent with their year thus far.
- Investors favored bond ETFs over stock ETFs, especially those in the ultrashort bond Morningstar Category.
- Active ETFs continued to grow at a much faster clip than their indexed peers.
- Vanguard led all ETF providers in August flows; other market leaders saw money leave.
- Another month of outflows pushed commodity ETFs’ 2023 exodus over $6 billion.
August Market Roundup
The exhibit below shows August returns for a sample of ETFs that serve as proxies for major asset classes. A blended portfolio peeled back 1.79% last month, as global stocks and U.S. bonds both finished August in the red.
August Market Performance Through the Lens of Analyst-Rated ETFs
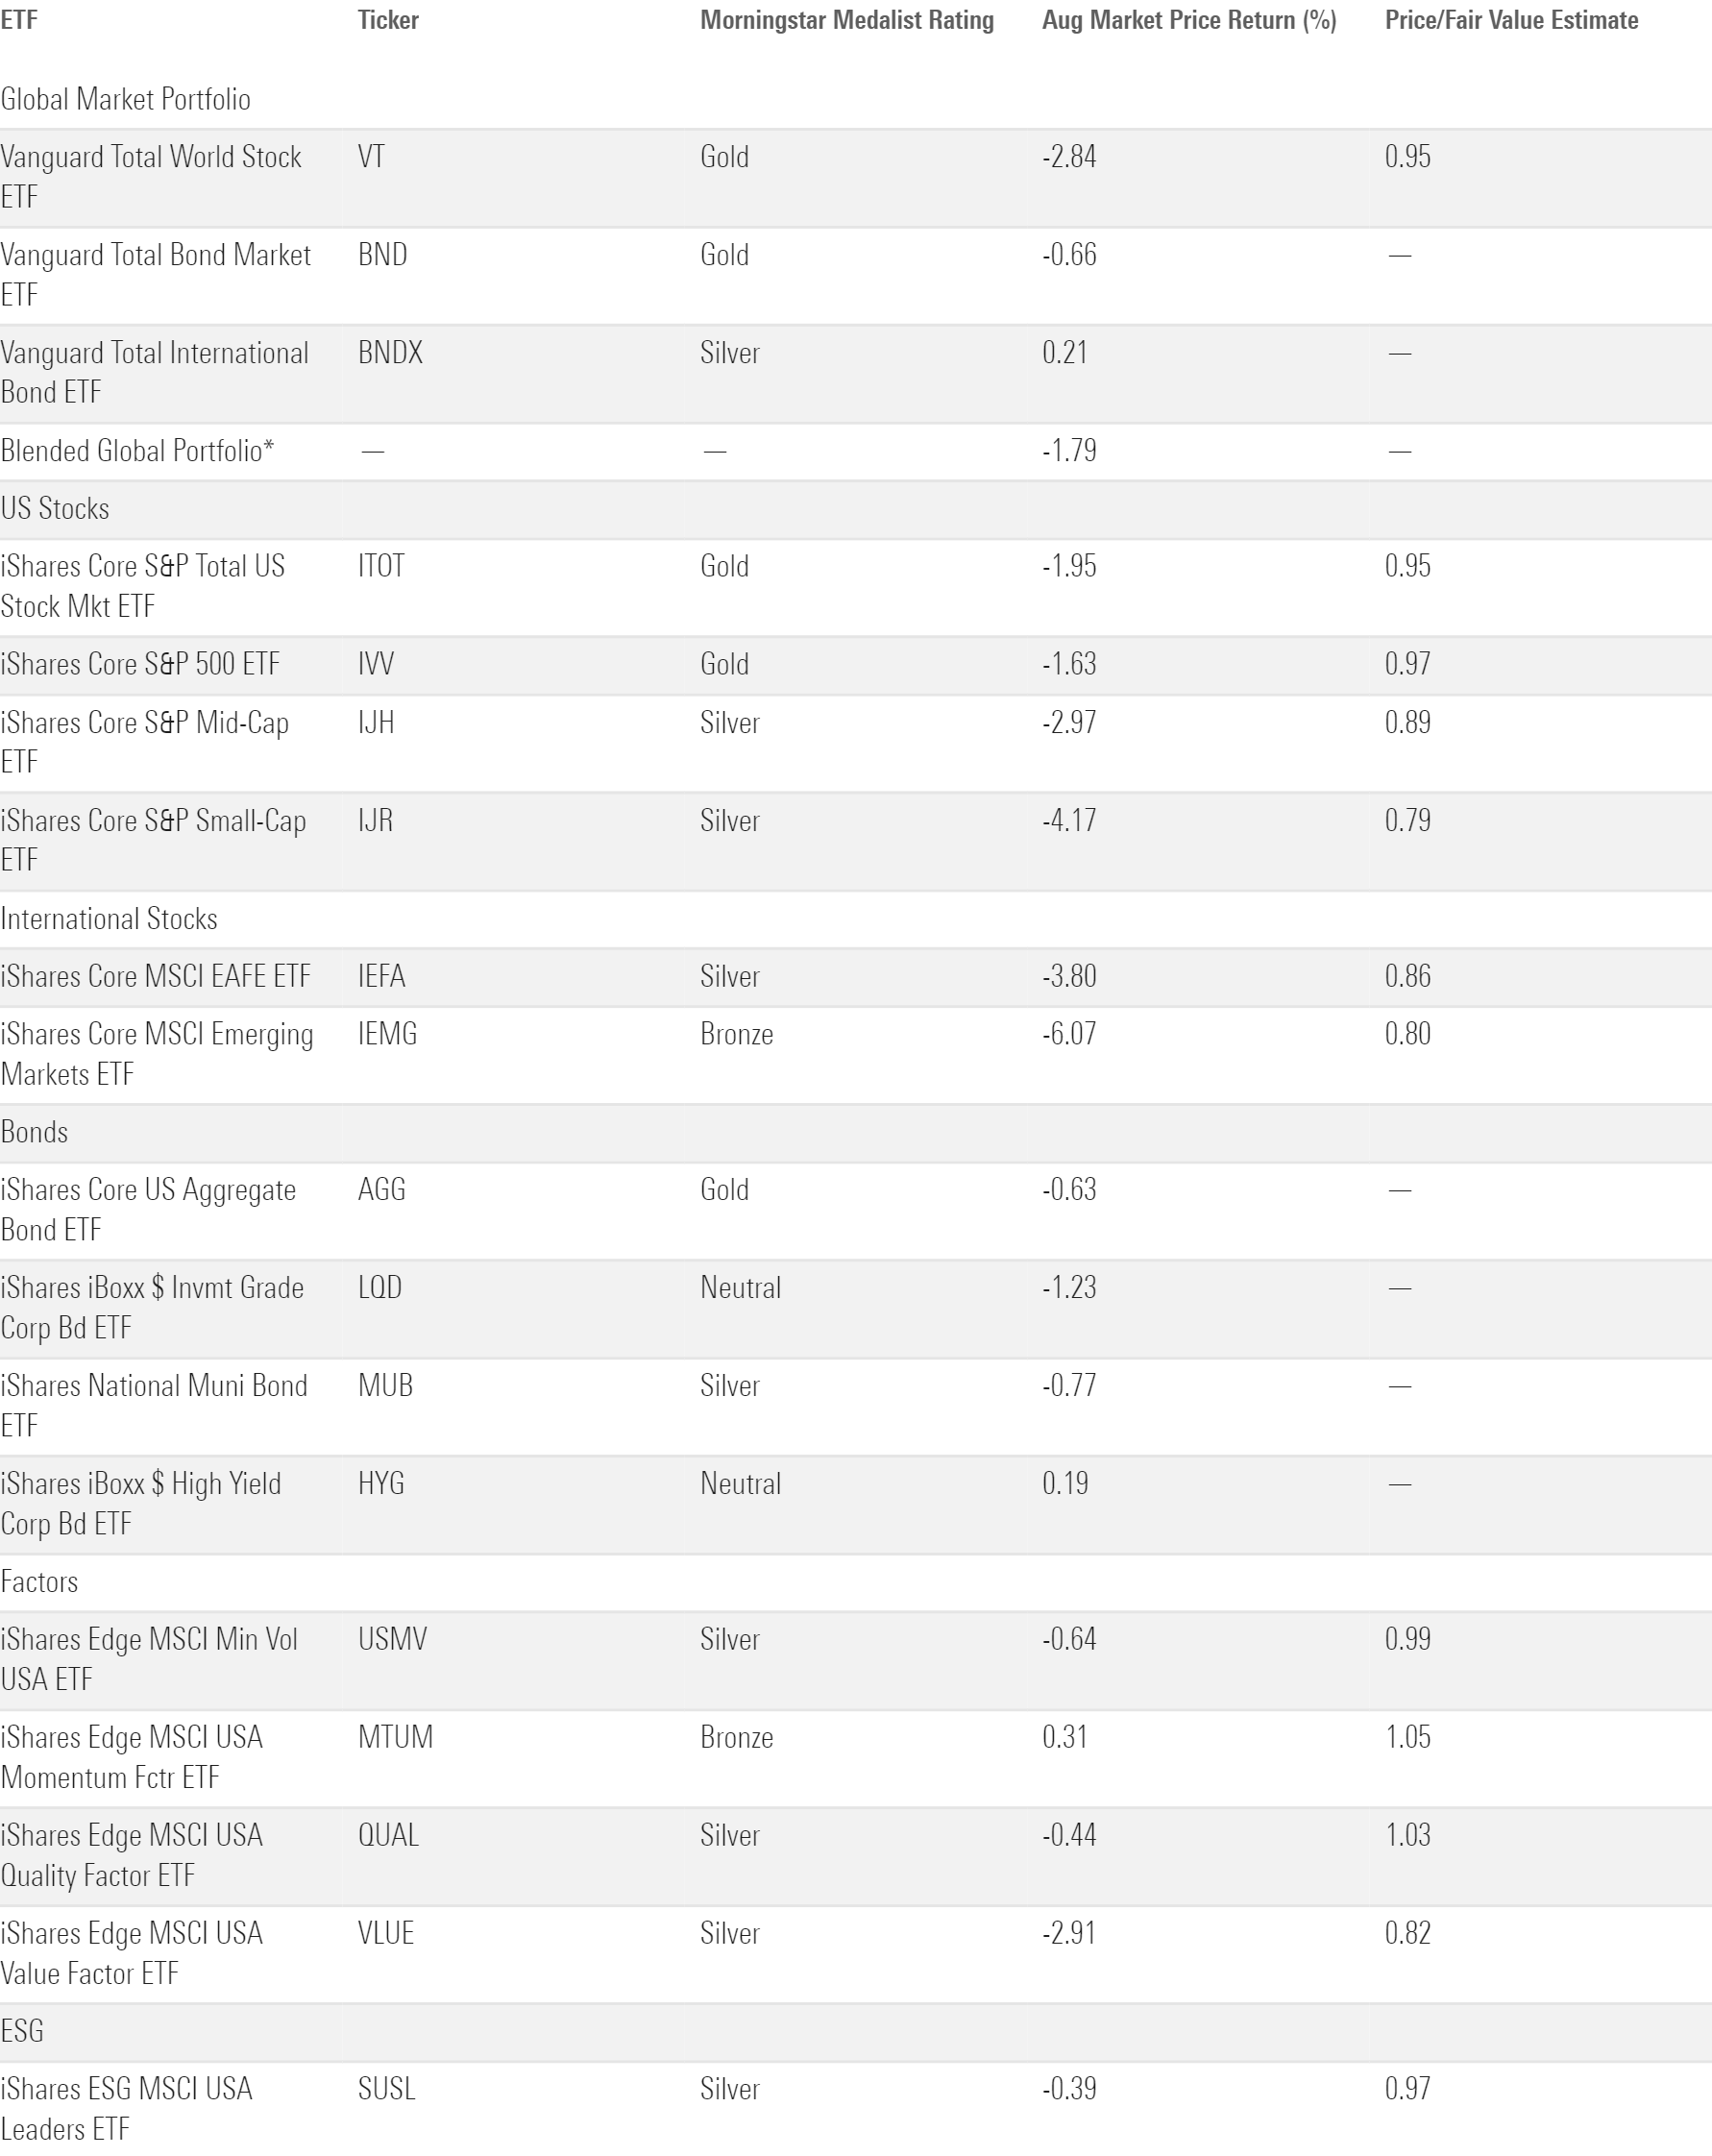
The blended portfolio’s bond sleeve saw mixed results in August. Vanguard Total Bond Market ETF BND shed 0.66%, but Vanguard Total International Bond ETF BNDX finished the month 0.21% higher than where it started. Stateside, strong retail data that surfaced midmonth suggested that consumers were well acclimated to higher interest rates, an indication that the Federal Reserve may raise rates or lower them later than expected to wrangle inflation. That said, the August jobs report showed a cooling labor market, which could throw cold water on inflation and interest-rate concerns. Looking ahead, CME’s FedWatch tool is skeptical that the Fed will dislodge rates when it meets in September.
Stocks finished August in the red, a sour close to an otherwise sweet summer for global equities. Vanguard Total Stock Market ETF VTI declined 2.84% on the month. The same economic factors that boosted bond yields may have weighed on U.S. stocks; VTI fell somewhat sharply in mid-August as investors expected hawkish policy from the Fed. A batch of encouraging earnings reports helped equities finish the month strong, though. Key among them was another sparkling update from Nvidia NVDA, which continues to crush the lofty standards to which investors hold it—a testament to the artificial intelligence boom that has propelled U.S. stocks this year.
Nvidia’s stellar month helped Vanguard Growth ETF VUG hold up 1.29 percentage points better than Vanguard Value ETF VTV in August. VUG edged out its value twin despite the latter’s larger stake in energy—the lone sector to finish August with a gain, as measured by State Street’s sector ETFs. That said, ETFs tracking the cheaper consumer staples, materials, and real estate sectors lost more than 3% apiece in August, and utilities companies shed more than 6%. Value stocks have been more competitive of late, but VTV remained about 30 percentage points behind VUG with two thirds of 2023 in the books.
After two strong months to kick off the summer, foreign stocks took a step back in August. Vanguard Total International Stock ETF VXUS shed 4.39%, its worst month since September 2022. There were few bright spots around the globe, but it was particularly rough for China and Netherlands equities, which jointly constitute more than 10% of VXUS. Morningstar indexes tracking those markets sank 8.92% and 9.59% in August, respectively.
8 Observations on ETF Flows
1) A quiet month of ETF flows was a microcosm for the year as a whole.
August has been a strong month for the past three years, with U.S. ETFs collecting $51 billion on average. This August, they pulled in a tepid $11.7 billion, inching their year-to-date haul to nearly $285 billion. That leaves them in far better shape than their open-end fund counterparts, which tallied over $200 billion of outflows since the calendar turned to 2023.
But by ETFs’ own lofty standards, this year has left much to be desired in terms of flows. They are on pace to finish the year with about $426 billion of new money. That would mark their smallest annual inflow since 2019 and the lowest calendar-year organic growth rate, which scales for assets, since ETFs took root in the late 1990s. For ETFs to continue the torrid yearly growth we’ve grown accustomed to, they will need a spectacular final act in 2023.
August Flows Across Morningstar Broad Category Groups
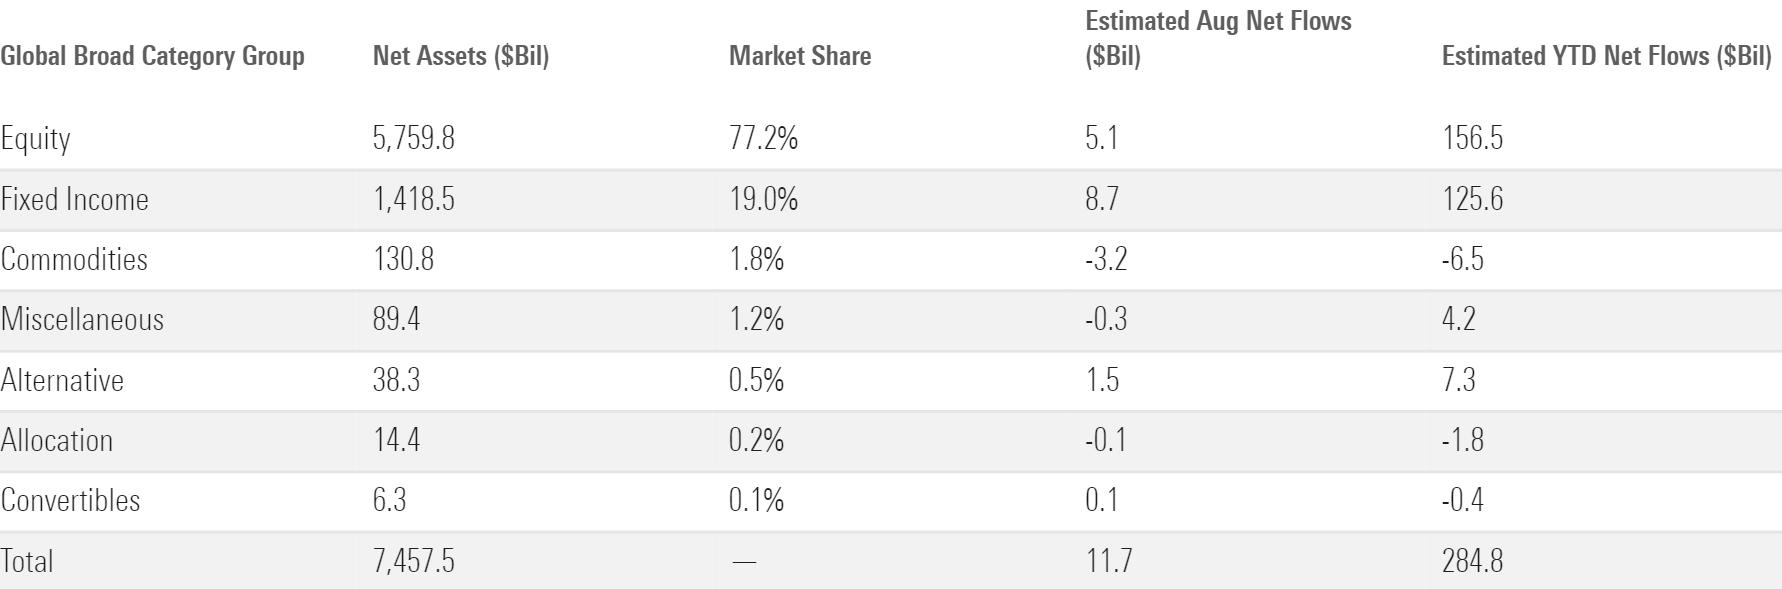
2) U.S. equity fund flows set the tone for the ETF market at large, for better or worse. In August, that was for worse.
More than half of all ETF assets sit in U.S. equity strategies. When these funds fail to generate robust inflows, it means the overall ETF market likely met the same fate. Indeed, U.S. stock ETFs collected a meager $3.4 billion in August as they cooled off from a hot summer of inflows.
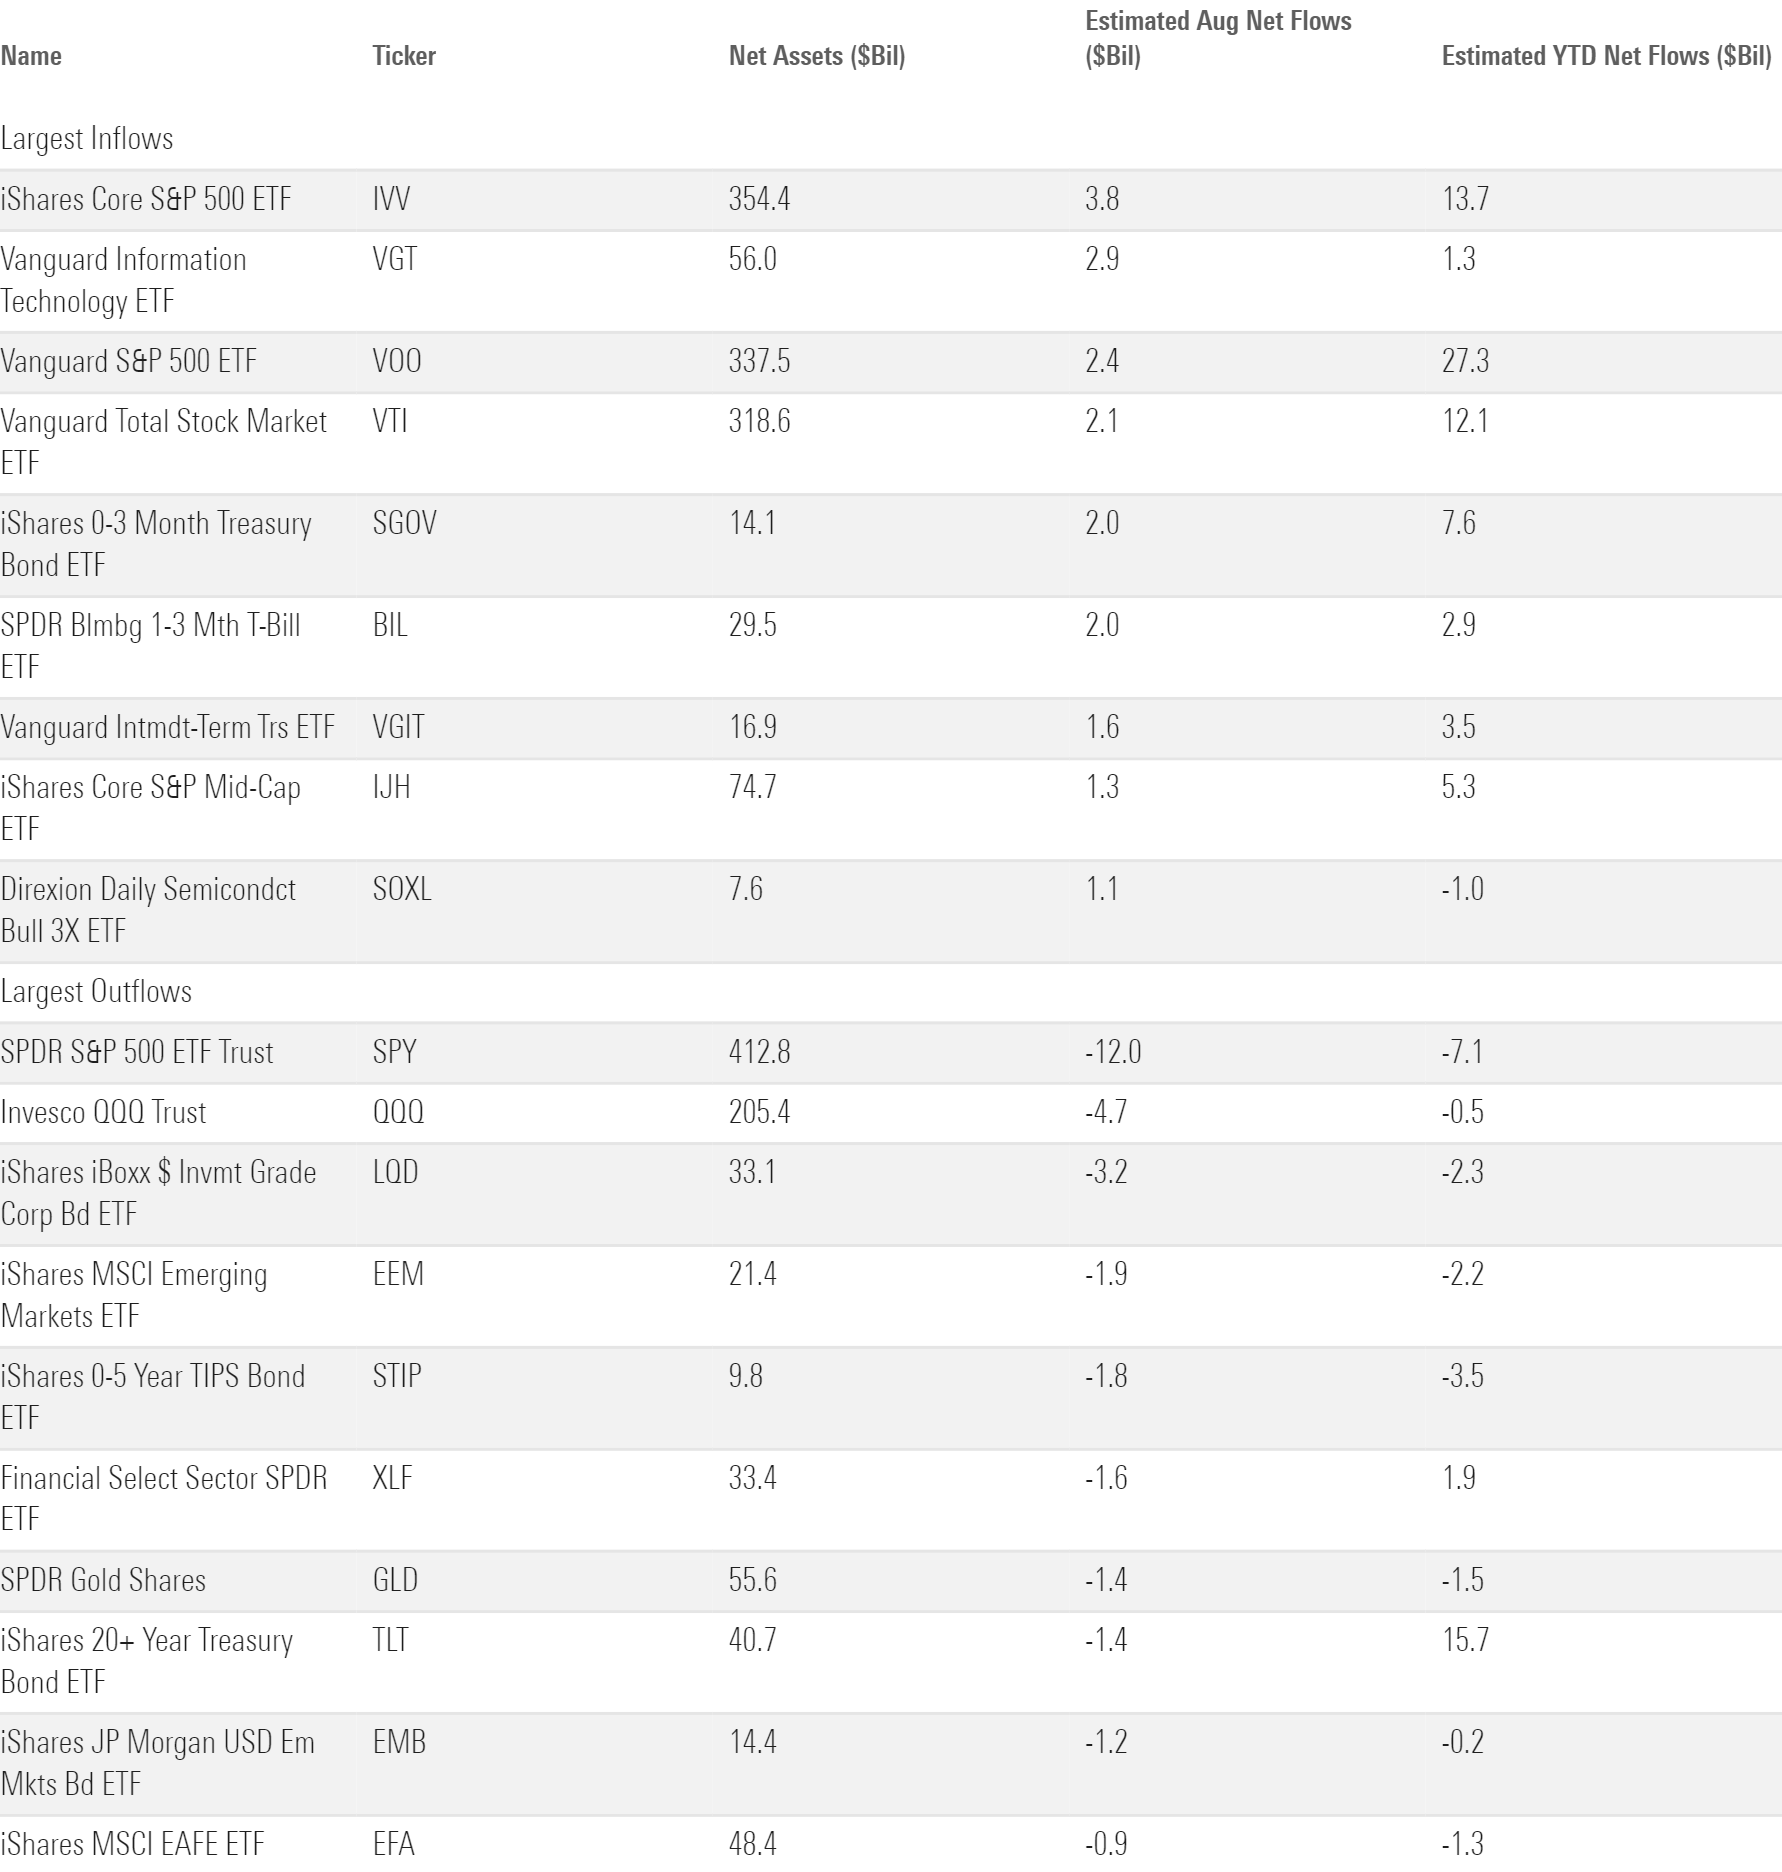
Within the U.S. equity category group, blend strategies made out the best. Large-, mid-, and small-cap blend funds collectively corralled $4.5 billion to keep the broader cohort above water. IShares core products led the charge within each segment. IShares Core S&P 500 ETF IVV reeled in $3.8 billion to lead its large-blend home and the overall ETF market, and IJH and IJR paced their respective categories with inflows of $1.3 billion and $512 million, respectively.
3) Growth- and value-stock ETFs remained on the periphery.
Growth stocks hit the skids early in August. They finished strong to salvage a respectable month, but many investors in the market’s largest growth ETF didn’t wait around to see it. Invesco QQQ Trust QQQ, whose $205.4 billion in assets makes it twice as large as its next-closest growth peer, shed $5.6 billion on the month. That pushed it into outflow territory for the year to date and stuck the large-growth category with $4.4 billion of August outflows. The mid- and small-growth categories booked mild outflows for the month as well.
Outflows from the growth categories don’t mean investors have jumped ship. Large-growth ETFs not named QQQ collectively gathered $1.5 billion of inflows in August. And demand remained strong for faster-growing sector ETFs in the sector-equity space: Technology ETFs reeled in $2.9 billion for the month, and communications funds collected a respectable $416 million. Funds that focus on the cheaper financial services, consumer defensive, real estate, and utilities sectors all finished the month in outflows.
Value ETFs quietly continued their recovery from a brutal start to the year. Large-value funds absorbed $1.1 billion in August, their third straight month of inflows after a five-month outflow streak kicked off the year. The recent turnaround is a positive sign, but much work remains for the large-value category: It has shed $13 billion for the year to date through August.
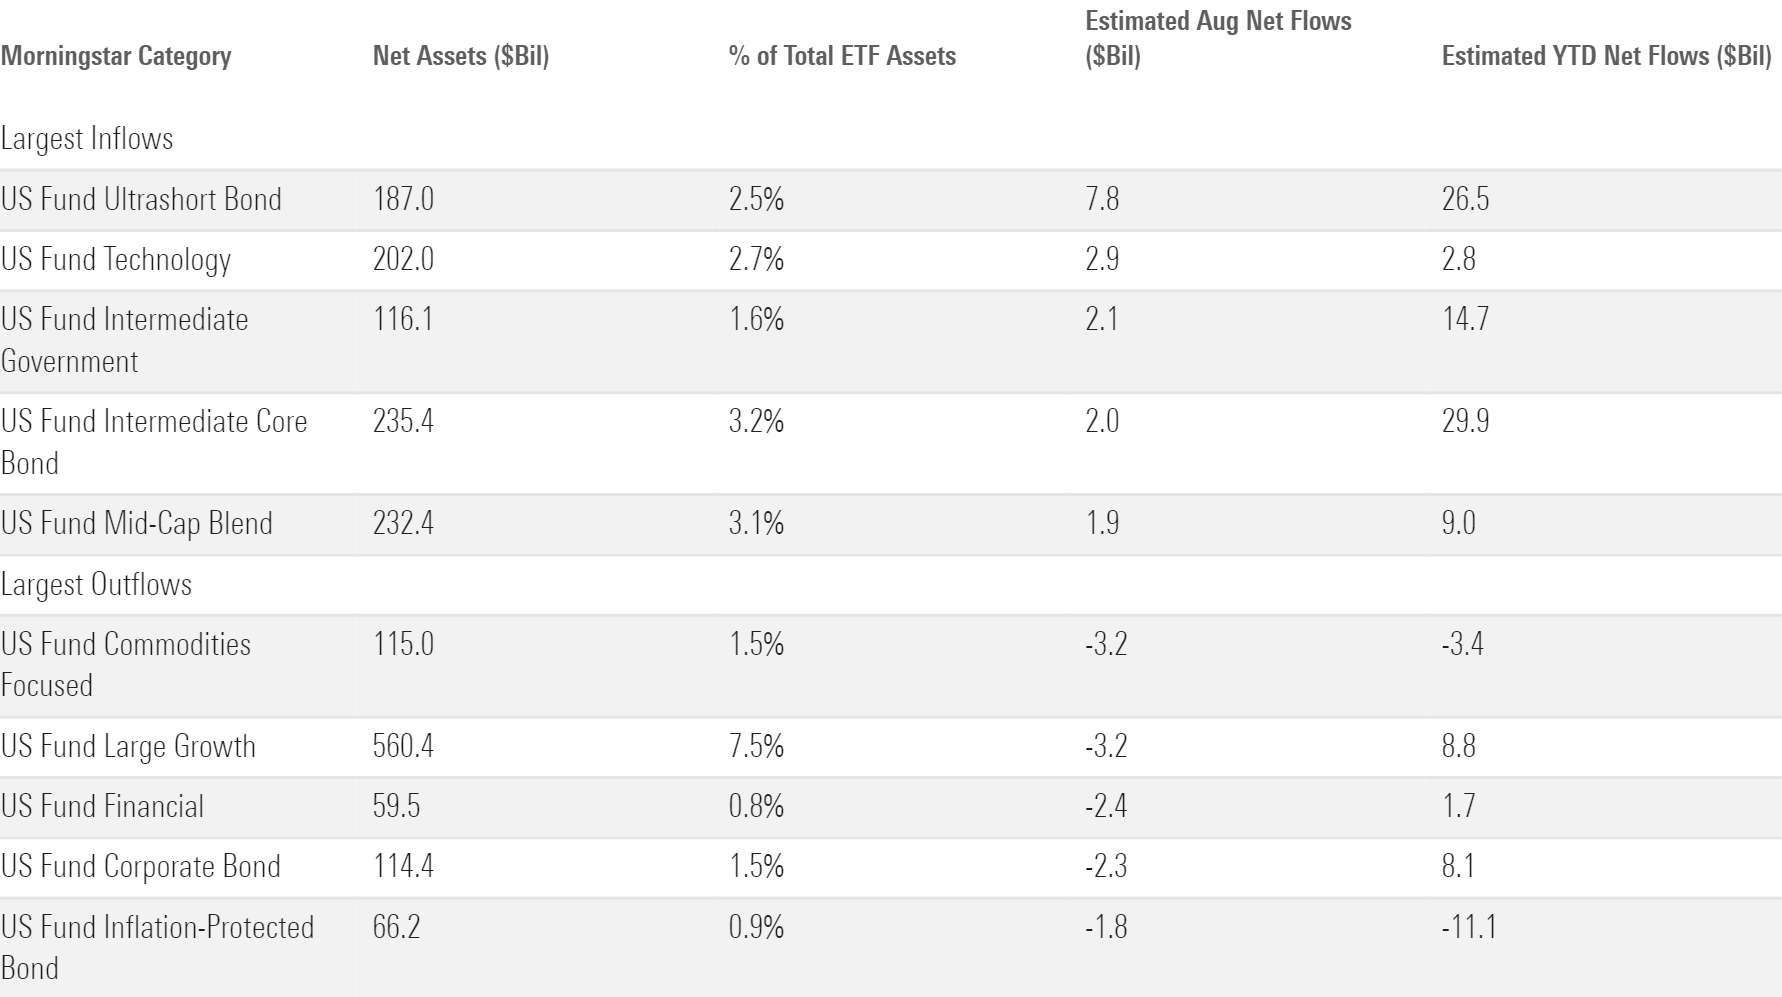
Morningstar Categories With the Largest August Flows
4) Fixed-income ETFs continued to plow ahead.
Bond ETFs have punched well above their weight. Two thirds of the way through 2023, they have claimed about 44% of all net flows despite representing just 19% of the market. That amounted to $125.6 billion of inflows on the year.
Consistency has been the key for bond ETFs. They have not suffered a month of outflows since January 2022, notching a 26.4% organic growth rate over that 19-month streak.
5) In keeping with the recent trend, the safer corners of the bond-fund universe powered its growth in August.
The ultrashort bond category, perhaps the lowest-risk zone of the fixed-income universe, led all bond categories with $7.8 billion of new money in August. IShares 0-3 Month Treasury Bond ETF SGOV and SPDR Bloomberg 1-3 Month T-Bill ETF BIL have been sought after for the safe, straightforward portfolios they spin: Each collected $2 billion of inflows in August. Stocked with Treasuries at the front end of the yield curve, ultrashort bond funds carry virtually zero credit or interest-rate risk. That safety plus the attractive yields that come with it form a recipe that has been hard for investors to ignore, especially when longer-dated alternatives don’t offer the same degree of income.
Even investors willing to venture further down the yield curve seem keen to avoid credit risk. Intermediate-government funds, which offer basically none of it, hauled in $2.1 billion in August, the second-most among fixed-income categories. The three government-bond categories collectively reeled in more than $54 billion over the first two thirds of 2023, good for an organic growth rate of 23.4%.
On the other hand, bond segments that shoulder more credit risk had a rough August. The corporate bond category shed $2.3 billion, and the high-yield and bank-loan categories both finished the month in outflows.
ETFs with the Largest August Flows
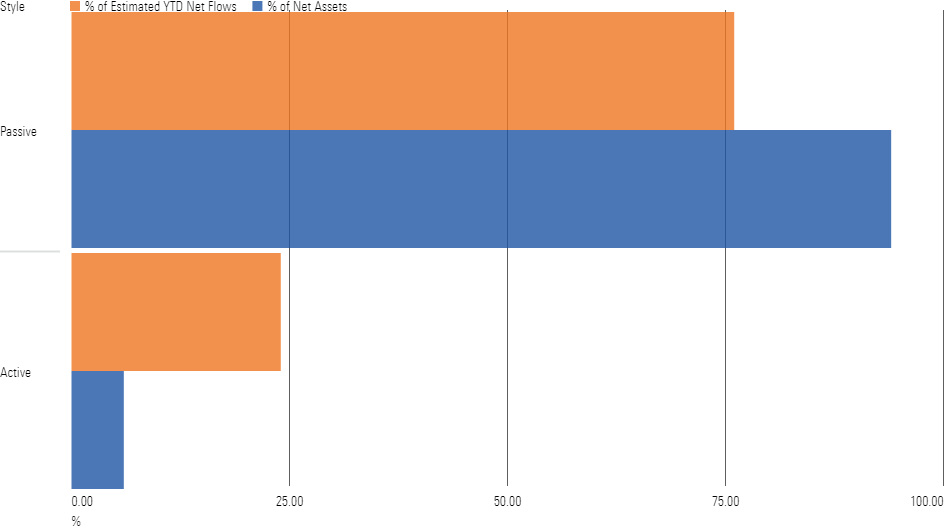
6) August was a loud reminder that active ETFs have arrived.
Active ETFs own a modest share of the total ETF market, but they have steadily pushed to center stage. When the book closed on 2022, active ETFs represented 5.3% of the market but claimed 14.4% of all net flows on the year. That is an excellent growth rate that active ETFs quickly blew past in 2023. For the year to date through August, they collected 23.7% of all net flows despite representing just 6% of the market. Last month was one of their most dominant yet, hauling in $9.8 billion to their indexed competitors’ $2 billion.
Active ETFs have generated strong 2023 inflows all over the map. The likes of Dimensional, Avantis, and Capital Group have led active U.S. equity ETFs to $17.6 billion of inflows for the year to date. Active nontraditional-equity ETFs, the home of JPMorgan Equity Premium Income JEPI, have collected $15.6 billion. International-equity and taxable-bond active options have garnered nearly $13 billion of inflows apiece. Even active alternative ETFs, spearheaded by covered-call strategies, have chipped in more than $7 billion. If last year proved that active management had a place in the ETF ecosystem, this year proves they need not be confined to one pocket of the market.
Active Funds Continue to Punch Above Their Weight
7) ETFs that track commodities continue to take it on the chin.
ETFs in the commodities group have collectively shed $6.5 billion so far in 2023, translating into a negative 4.94% organic growth rate. This cohort is composed of two categories: focused, which features concentrated portfolios of commodities like precious metals or oil; and broad basket, which houses strategies like Invesco Optimum Yield Diversified Commodity Strategy no K1 ETF PDBC, a diversified bundle whose performance relies on a smattering of commodities. Investors have yanked over $3 billion from each in 2023. Some investors use commodities for inflation protection. Since many believe the worst inflation is in the rearview mirror, these categories have faced outflows alongside fellow inflation-beating spaces like Treasury Inflation-Protected Securities and bank-loan funds.
8) Aside from steady Vanguard, the largest ETF providers lost steam in August.
IShares shed $3.7 billion last month because its fixed-income products endured outflows. That is a stark reversal from the rest of the year: iShares’ fixed-income ETFs have pulled in $51.1 billion in 2023, while the rest of its products bled a total of $11.8 billion. In August, corporate bonds were the culprit. IShares iBoxx $ Investment Grade Corporate Bond ETF LQD shed $3.2 billion on the month, the third most among all ETFs. Outflows from iShares’ TIPS and emerging-markets bond products also weighed on flows, offsetting the strong months from its ultrashort-bond products.
August Flows for the 10 Largest ETF Providers

State Street’s overall ETF flows tend to go as SPDR S&P 500 ETF Trust SPY and its sector ETFs go. That route led to outflows in August. SPY bled $12 billion in a characteristically volatile month of flows, more than double the next closest competitor. State Street’s suite of sector funds didn’t help the cause. Led by a $1.6-billion exodus from Financial Select Sector SPDR ETF XLF, its sector-equity lineup collectively shed $3.1 billion.
The explanation for Invesco’s $4.2 billion of August outflows starts and ends with QQQ. It represents nearly half of Invesco’s ETF assets, so when it doesn’t fare well, the rest of the roster needs to pick up the slack. In August, that didn’t happen: No other Invesco ETF posted inflows or outflows greater than $1 billion.
Expand Your Horizons, Enhance Your Discount
The fair value estimate for ETFs rolls up our equity analysts’ fair value estimates for individual stocks and our quantitative fair value estimates for stocks not covered by Morningstar analysts into an aggregate fair value estimate for stock ETF portfolios. Dividing an ETF’s market price by this value yields its price/fair value ratio. This ratio can point to potential bargains and areas of the market where valuations are stretched.
The 10 Most Under- and Overvalued Analyst-Rated ETFs
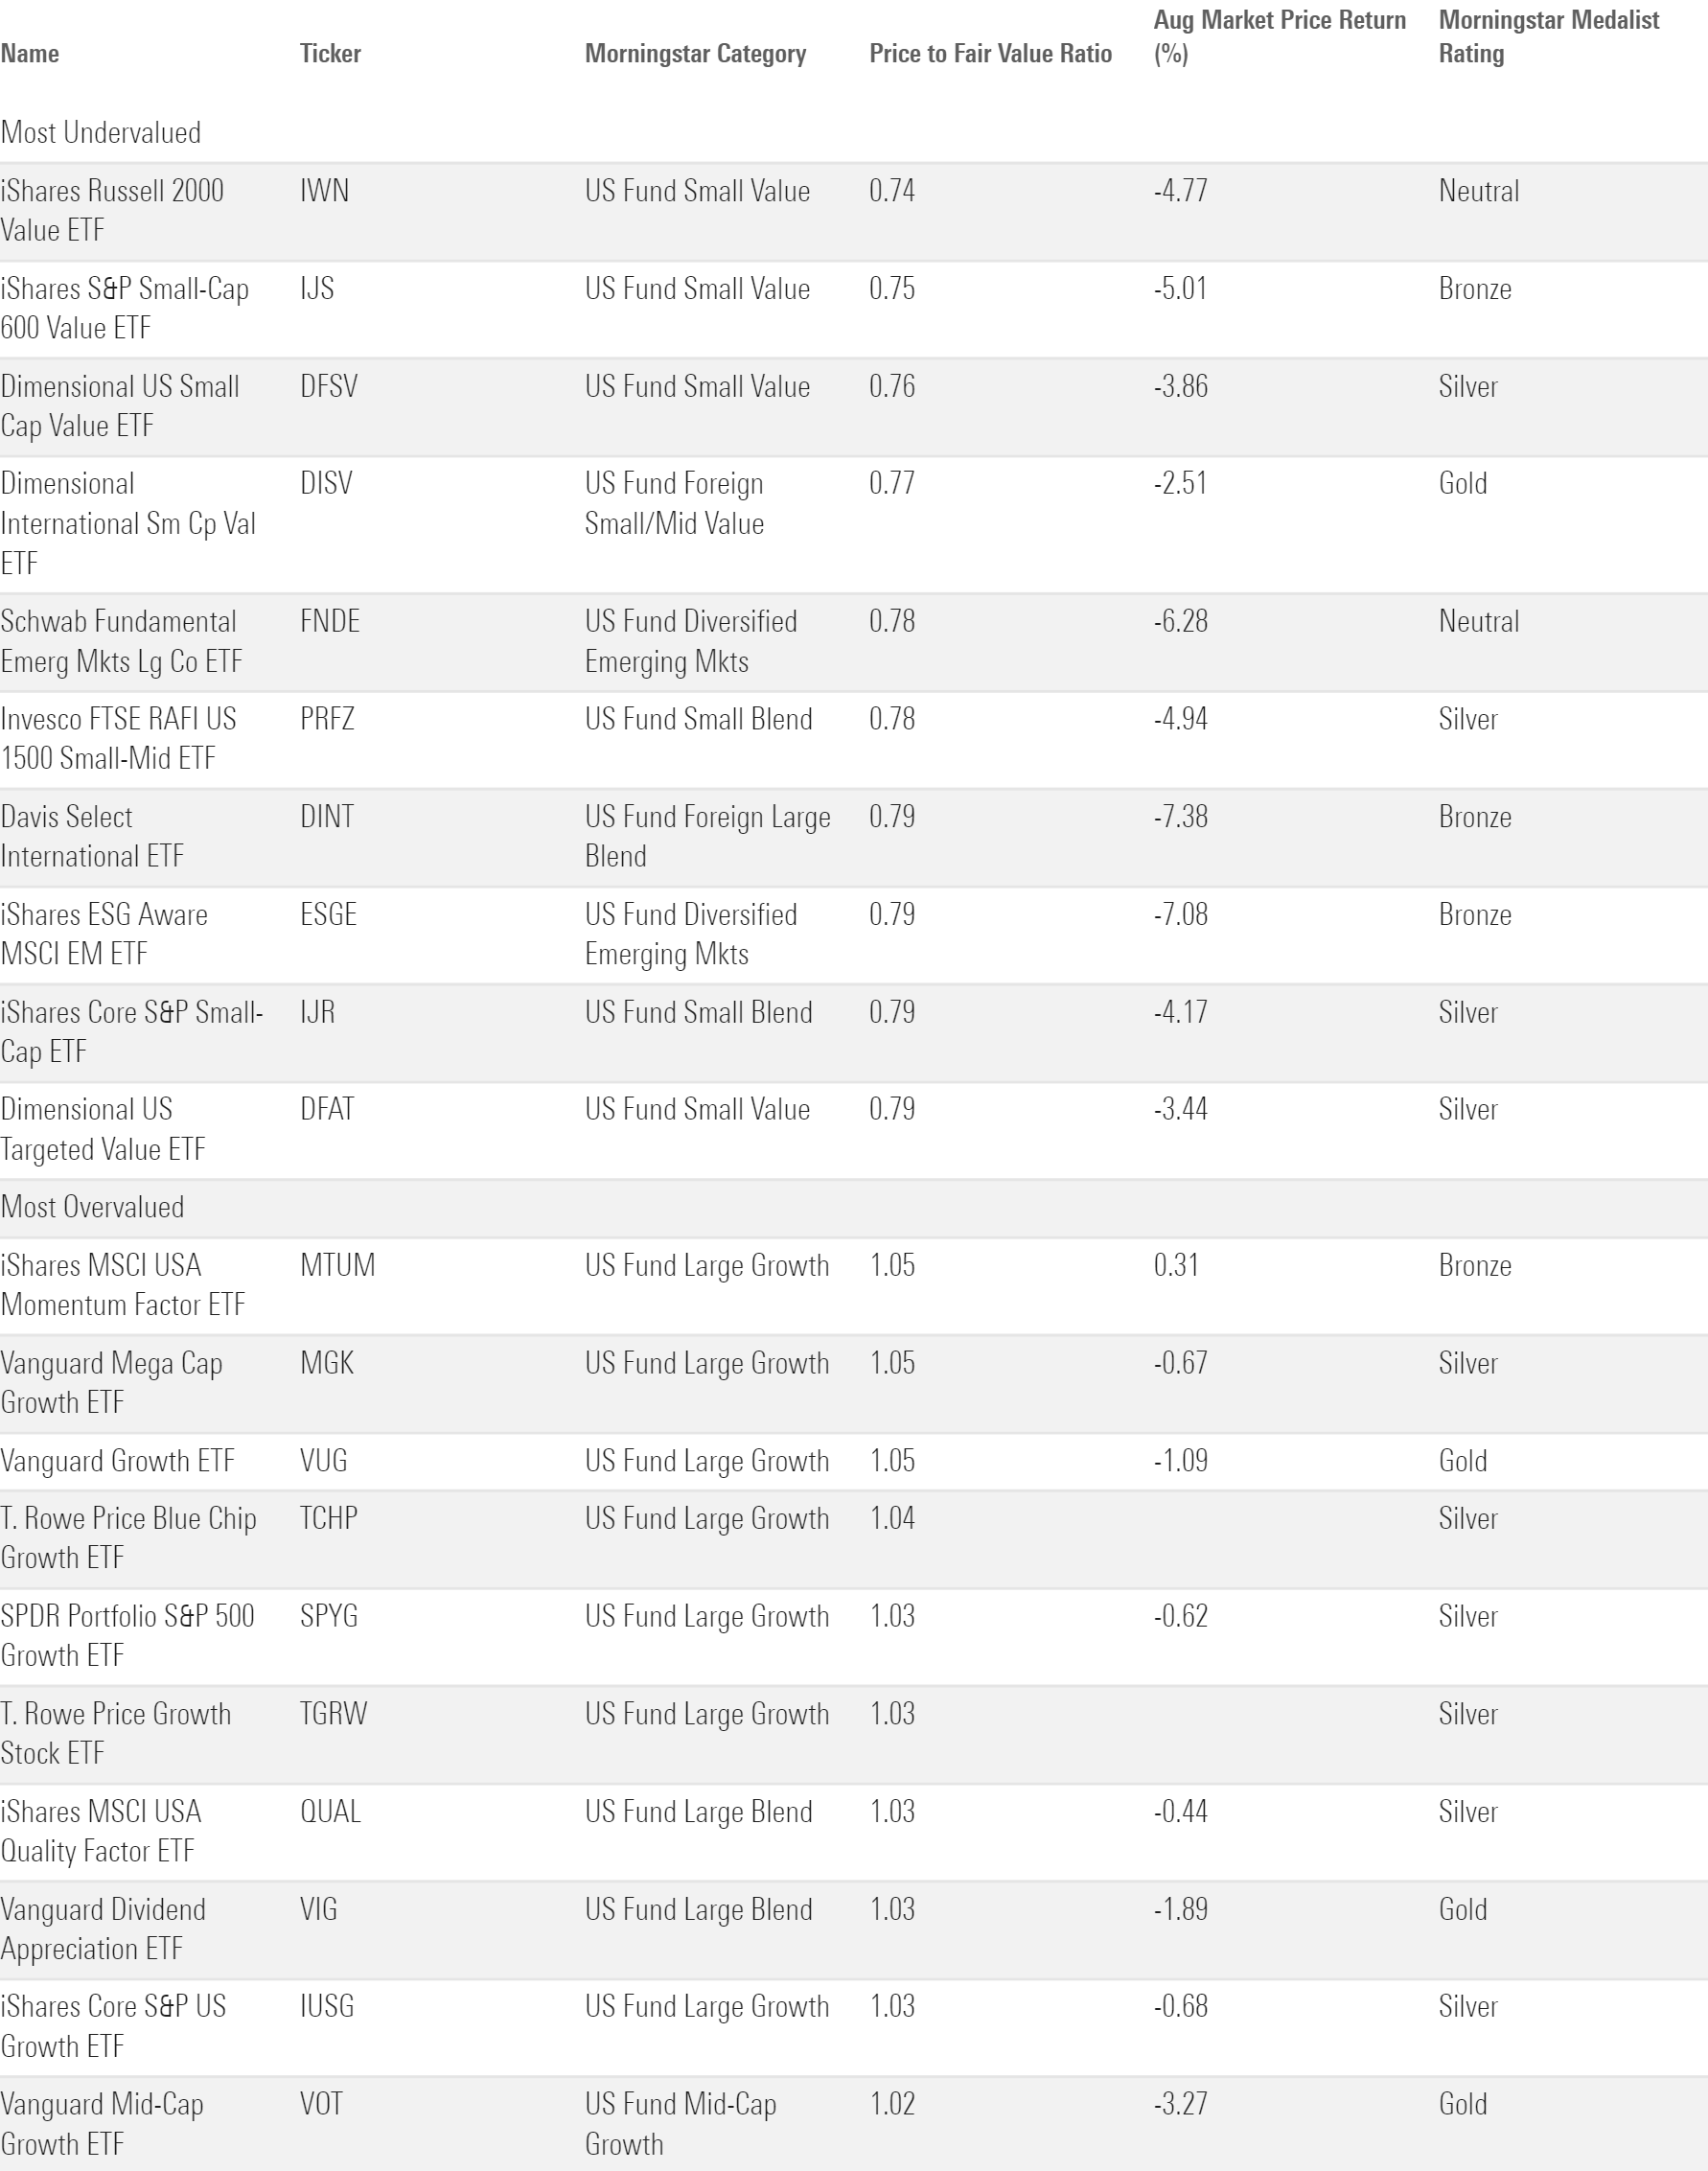
Investors hunting for bargains may find themselves shopping for small-value ETFs. Among the ETFs rated by Morningstar analysts, U.S. small-value funds traded 22% below their fair value on average. There is variance between the options, though. IShares S&P Small-Cap 600 Value ETF IJT came with a 25% discount, compared with 15% for Vanguard Small-Cap Value ETF VBR. If a 10-percentage-point difference seems like a wide gap between these two category peers, consider how little they share: At the end of August 2023, only 16% of the two portfolios overlapped. Such little common ground explains why price/fair value ratios can differ and illuminates the importance of differences in benchmark construction.
The broad U.S. market traded near its fair value at the end of August but still looked expensive next to broad foreign-stock portfolios. Investors looking for better deals than the 1% discount attached to VTI may benefit from expanding their borders. VXUS came at a cheaper 0.88 price/fair value ratio at the end of August, and iShares Core MSCI EAFE ETF IEFA was cheaper still at 0.86. Those comfortable with an extra increment of risk may venture into emerging markets, where IEFA was available at a 20% discount. That said, it’s important to remember that markets may be valued a certain way for good reasons. U.S. stocks have been pricier than their foreign counterparts for quite some time, and those willing to pay the premium have been rewarded.
The author or authors own shares in one or more securities mentioned in this article. Find out about Morningstar’s editorial policies.
/cloudfront-us-east-1.images.arcpublishing.com/morningstar/ZHTKX3QAYCHPXKWRA6SEOUGCK4.png)
/d10o6nnig0wrdw.cloudfront.net/05-13-2024/t_4a71dba80d824d828e4552252136df22_name_file_960x540_1600_v4_.jpg)
/cloudfront-us-east-1.images.arcpublishing.com/morningstar/24UPFK5OBNANLM2B55TIWIK2S4.png)
:quality(80)/s3.amazonaws.com/arc-authors/morningstar/30e2fda6-bf21-4e54-9e50-831a2bcccd80.jpg)