
3 Assets That Might Not Diversify as Well as You Think
Real estate, high-yield bonds, and cryptocurrency don’t always live up to their reputation as portfolio diversifiers.
/s3.amazonaws.com/arc-authors/morningstar/360a595b-3706-41f3-862d-b9d4d069160e.jpg)

Diversification is a core principle of sound investing. A portfolio that includes assets with different performance characteristics often leads to better risk-adjusted returns than one that relies on a single asset class. But building a diversified portfolio can be easier in theory than practice.
Indeed, many asset classes often touted as good portfolio diversifiers may not live up to their reputation in practice. In this article, I’ll dig into three areas that may not provide as many benefits as expected when combined with other assets in a portfolio.
Real Estate
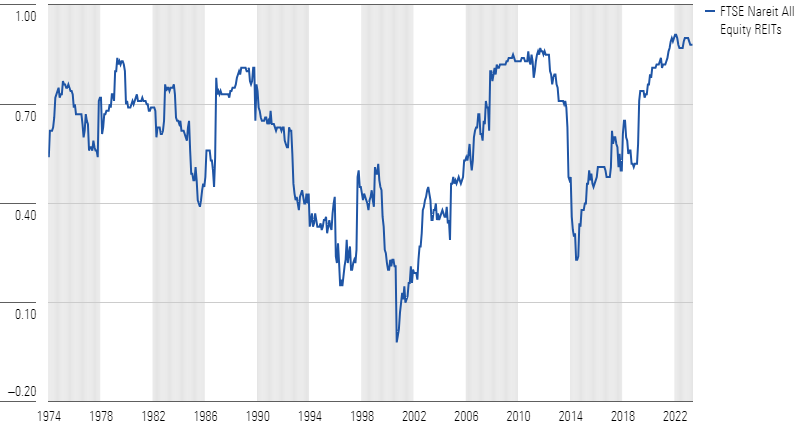
In some past periods, real estate investment trusts didn’t move closely in tandem with the broader US equity market. Rolling three-year correlations have dropped as low as 0.10 during some periods, such as the early 2000s. Being untethered to the overall equity market can lead to better risk-adjusted returns when real estate is added to a diversified portfolio. In recent years, however, real estate has generally moved more in line with stocks overall. For the trailing three-year period ended April 30, 2024, for example, the FTSE Nareit All Equity REITs Index had a correlation of 0.88 with the broader equity market.
Rolling Three-Year Correlations: Real Estate vs. Stocks
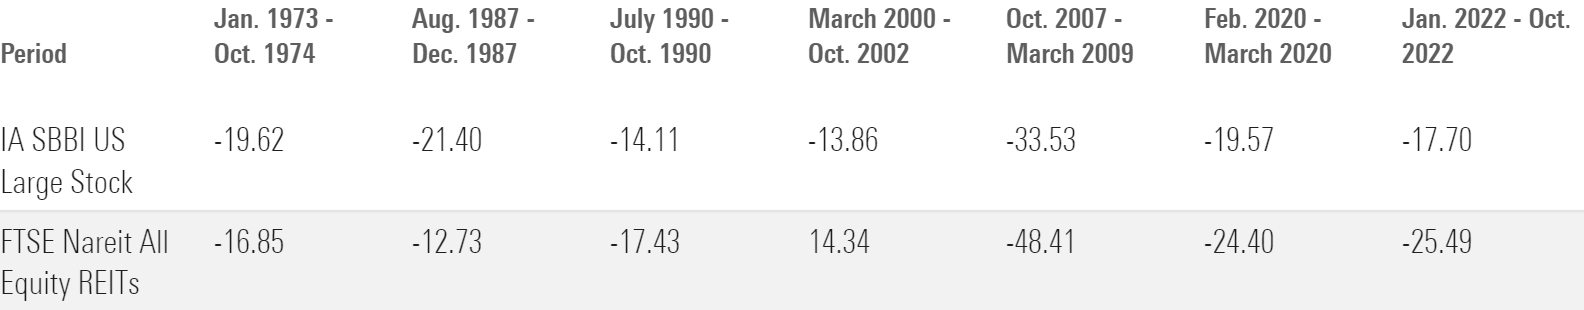
Real estate’s rising correlation with the overall equity market has also made it a less valuable cushion against bear-market declines. Real estate had previously held up better than the overall market during some market corrections, such as those in 1973 and 1974, late 1987, and the tech-stock correction that started in early 2000. But during the three most recent bear markets—including an especially painful drawdown in the global financial crisis—real estate suffered heavier-than-average losses.
Real Estate Drawdowns
High-Yield Bonds
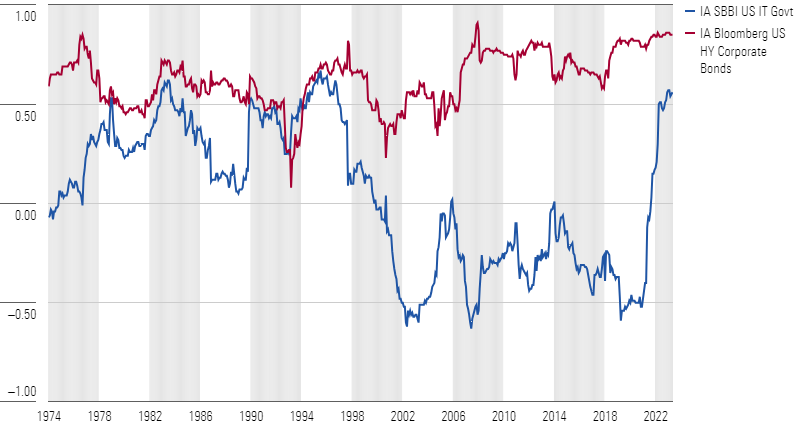
High-yield bonds (also known as junk bonds) are issued by corporations with below-average credit ratings, generally defined as BB+ or lower from a major credit rating agency. As a result, they tend to trade more in line with broad credit markets, overall economic trends, and company-specific factors than they do with Treasuries. As a result, they’re less sensitive to interest-rate movements than investment-grade bonds, which means they can provide diversification benefits within the bond portion of a portfolio.
At the same time, though, high-yield bonds have a relatively high correlation with stocks. Because of their heavier debt burdens and higher levels of business risk, high-yield bonds typically suffer during periods of weaker economic growth, which are also negative for stocks. As a result, high-yield bonds have had a correlation of 0.88 when measured against stocks for the most recent three-year period through April 30, 2024.
Rolling Three-Year Correlations vs. Stocks
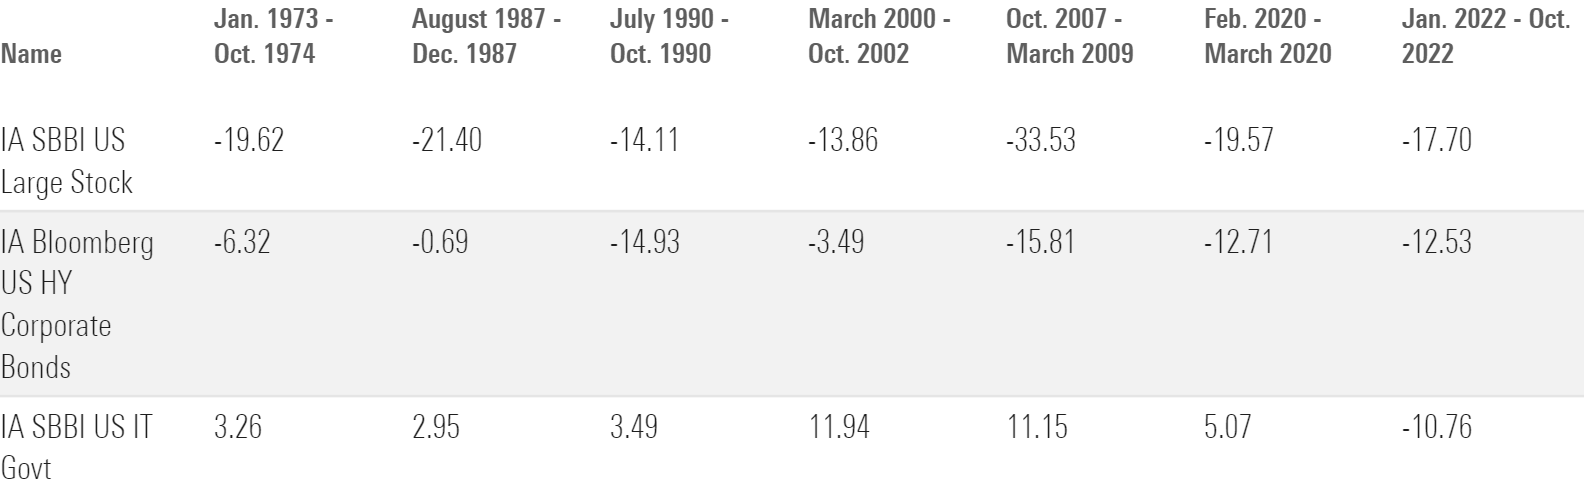
Granted, high-yield bonds have historically provided some protection from market drawdowns. As shown in the table below, they usually don’t suffer as much as stocks during bear markets. However, Treasuries have done a much better job of cushioning downside risk.
High-Yield Bond Drawdowns
Cryptocurrency
As an asset that exists purely in digital form, cryptocurrency is fundamentally different from other major asset classes. Bitcoin, the oldest and most established cryptocurrency, still accounts for most of the investor interest and assets, but numerous digital currencies have also attracted more attention from both retail and institutional investors over the past couple of years.
As a nontraditional asset, cryptocurrency has had an extremely low correlation with most other major asset classes. Over the past 10 years, bitcoin and other major cryptocurrencies have had a correlation of less than 0.3 when measured against stocks, bonds, real estate, gold, commodities, and other asset types.
But there are two reasons crypto may not make the best portfolio diversifier. First, as digital assets have attracted more interest from mainstream investors, correlations have steadily trended up in recent years. For the trailing three-year period ended in 2023, the MarketVector Bitcoin Index had a correlation coefficient of 0.55 with stocks (as measured by the Morningstar US Market Index), but that was up from correlation numbers near zero (or even below zero) in some previous periods.
Rolling Three-Year Correlations: Cryptocurrency vs. Stocks
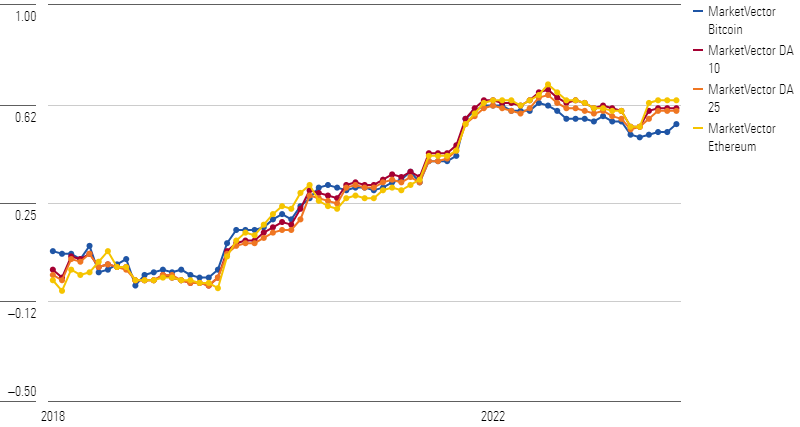
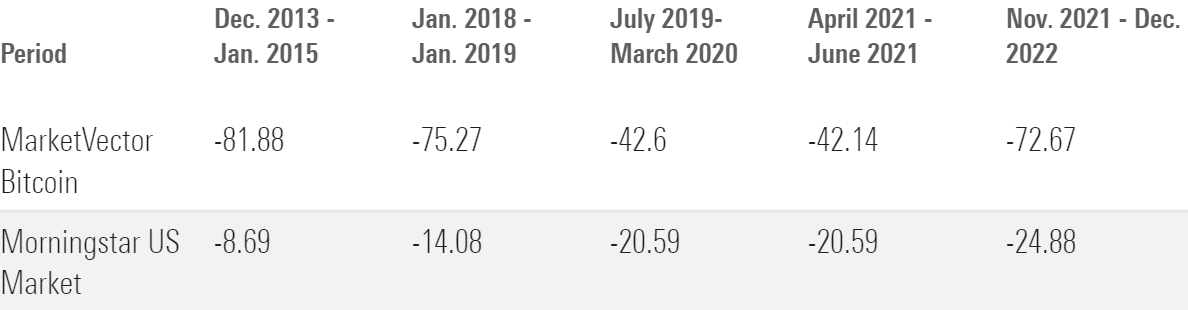
Second, crypto’s potential diversification value has been overshadowed by its extreme performance swings. Instead of acting like a noncorrelated asset, digital assets are mainly defined by their extreme volatility. Over the past three years, bitcoin has been nearly 4 times as volatile as stocks. Much of this volatility has been on the upside, but bitcoin and other cryptocurrencies have also been subject to extreme drawdown risk. In 2022, for example, the MarketVector Bitcoin Index dropped about 65% for the year and the broader MVIS CryptoCompare Digital Assets 10 Index lost more than 69% of its value. Bitcoin has also suffered several other large drawdowns in recent years, as shown in the table below.
Cryptocurrency Drawdowns
Takeaways
The three examples discussed above underscore two of the limitations of correlation metrics. First, correlations can change over time, meaning that assets that were once great diversifiers may no longer be so. And second, even assets that still have a relatively low correlation coefficient may still be subject to above-average downside risk.
The author or authors do not own shares in any securities mentioned in this article. Find out about Morningstar’s editorial policies.
/cloudfront-us-east-1.images.arcpublishing.com/morningstar/ZOMUI7V4LVD37GYFMSENZFH3GM.png)
/cloudfront-us-east-1.images.arcpublishing.com/morningstar/HCVXKY35QNVZ4AHAWI2N4JWONA.png)
/cloudfront-us-east-1.images.arcpublishing.com/morningstar/EC7LK4HAG4BRKAYRRDWZ2NF3TY.jpg)
:quality(80)/s3.amazonaws.com/arc-authors/morningstar/360a595b-3706-41f3-862d-b9d4d069160e.jpg)