
Taking Tax-Loss Harvesting to the Next Level
Adding leveraged, long-short factor strategies can improve tax alpha.
/s3.amazonaws.com/arc-authors/morningstar/8c5d95ea-6364-418e-82fc-473134024ece.jpg)

The empirical research has shown that tax-loss harvesting strategies in separately managed accounts can improve the post-tax returns of an investment portfolio by employing a strategy of selling positions in securities with losses in order to generate capital losses that can be used to offset gains generated in the overall portfolio. The Internal Revenue Code permits capital losses to be netted against capital gains in the year they occur. Unused losses can be carried forward indefinitely, deductible against future net capital gains plus an additional $3,000 deductible against ordinary income per year.
Since long-term capital gains are often taxed at lower rates, a tax-loss harvesting strategy can improve a portfolio’s aftertax performance. While long-term losses are generally hard to realize systematically because stock positions on average appreciate over time, in the short term, volatility allows for the capture of short-term losses. The result is that most losses end up being short-term, which can be used to offset highly taxed short-term gains. With that said, most of the benefit from tax-loss harvesting is from the deferral of gains (offsetting realized gains from other assets in the portfolio).
A key benefit of tax-loss harvesting is that it can allow investors with concentrated positions in low-basis stock to diversify their holdings as tax-loss harvesting losses are realized—the losses are used to offset some, or all, of the taxes due on the sale of the low-basis stock. It can also help offset the capital gains taxes generated by less tax-efficient (higher turnover) equity strategies such as those of active managers.
Tax-Loss Harvesting Research Findings
Shomesh Chaudhuri, Terence Burnham, and Andrew Lo, authors of the study “An Empirical Evaluation of Tax-Loss Harvesting Alpha,” published in the June 2020 issue of CFA Institute’s Financial Analysts Journal, evaluated the magnitude of the benefit of tax-loss harvesting (tax alpha) using historical data from the Center for Research in Securities Prices monthly database for the 500 securities with the largest market capitalization from 1926 to 2018. The base case in their analysis used a 1% per month addition to the portfolio. They found:
- Given long- and short-term capital gains tax rates of 15% and 35%, respectively, tax-loss harvesting produced a tax alpha of 1.10% per year when unconstrained by the wash-sale rule. Transactions costs reduced that to 0.94%.
- When constrained by the wash-sale rule, the gross tax alpha decreased from 1.10% to 0.85% per year, or 0.69% net. To avoid the wash-sale rule, an investor would have to buy a different security with similar characteristics and a high correlation of returns. Honoring the wash-sale rule would introduce some tracking error between the portfolio and the benchmark.
- The tax alpha varied strongly across different periods. During the 1926-49 subsample, the average annualized alpha was 2.29% per year. Conversely, during the 1949-72 subperiod, the average annualized alpha was a modest 0.57% per year. Finally, the 1972-95 and 1995-2018 periods fell between these extremes, with annual alphas of 1.04% and 0.83% per year, respectively.
- The performance of the tax-loss harvesting strategy could be substantially affected by the rate of investor contributions into and out of the portfolio. As capital flowed into the portfolio, new shares needed to be bought, generally at a higher cost basis, providing more opportunities to harvest losses and generate tax credits.
- Tax alpha increased monotonically with the tax rate.
- Tax alpha increased with a higher contribution per month.
Their findings are consistent with those of Kevin Khang, Thomas Paradise, and Alan Cummings, authors of the study “Expected Loss Harvest from Tax-Loss Harvesting with Direct Indexing,” published in The Journal of Beta Investment Strategies (Vol. 14, Issue 3). They examined a direct indexing investment (buying the individual stocks that make up an index in the same weights as the index instead of buying a mutual fund or exchange-traded fund that tracks the index) to gain an understanding of the “loss harvest profile”—the total cumulative losses one may expect to harvest over the long term and the contour of the cumulative losses. The constituents of their U.S. equity capitalization-weighted index came from the top 400 securities by market capitalization in the Axioma US4 risk model. They ran 64 tax-loss harvesting simulations starting in January and July of each year from 1982 to 2013 and ending 10 years later.
Their direct indexing portfolio received an initial cash contribution at the beginning of the 10-year period and the beginning of any subsequent years based on the cash contribution scenario: 0%, 5%, 20%, and 100% of the initial cash contribution in all subsequent years. During the 10-year run, all subsequent cash infusion, dividends, and proceeds from security sales were kept in cash until a cash threshold of 1% of starting wealth was breached, when all available cash was invested toward the target allocation of the portfolio. Loss harvesting was initiated if a given tax lot was in breach of a loss threshold of 5% relative to the cost basis. For all trading, they applied one-way trading costs of 10 basis points. Here is a summary of their key findings:
- For a lump-sum investor with no subsequent cash contributions, tax-loss harvesting with direct indexing might harvest about 30% of the principal and dividends invested over a 10-year period.
- There was a significant variation around this estimate, with a minimum of 12% and a maximum of 62%.
- The volatility environment in the first few years of a tax-loss harvesting program was a critical determinant of the level and the contour of the cumulative loss harvest over the 10-year period.
- Ending with a high cumulative loss harvest required starting tax-loss harvesting in the middle of a bear market environment; these cases experienced the slowing of loss-harvesting intensity (“plateauing”) after the first few years of tax-lost harvesting.
- Cases with a low cumulative loss harvest started in a bull market and harvested the lion’s share of total losses later in the 10-year period; loss-harvesting intensity persisted throughout much of the 10-year period for these cases.
- Additional cash contributions reduced the importance of starting tax-loss harvesting in a bear market for a productive loss-harvesting experience.
- With additional cash infusion, the cumulative loss harvest’s variability was reduced by 20% and its sensitivity to the volatility environment by 50%.
We next review a paper that compared the performance of tax-loss harvesting when applied to a portfolio of individual stocks against a portfolio of ETFs, which are typically highly tax-efficient because of their ability to accommodate investment inflows and outflows by creating or redeeming “creation units” (baskets of assets that approximate the entirety of the ETF investment exposure). As a result, investors usually are not exposed to significant capital gains distributions.
A Horse Race Between Direct Indexing and ETFs
Roni Israelov and Jason Lu, authors of the study “A Tax-Loss Harvesting Horserace: Direct Indexing vs ETFs” published in The Journal of Beta Investment Strategies, Direct Indexing Special Issue 2023 (Vol. 14, Issue 3), used a Monte Carlo simulation framework to compare the efficiency of implementing a tax-loss harvesting program on a portfolio of stocks against an ETF. They began by noting: “Intuitively, a portfolio of stocks should provide greater opportunities for harvesting, as well as increased consistency. Harvesting opportunities can be present in individual holdings even when the market (and its associated ETF) has positive returns.”
They also noted that, in their 2022 paper, “Optimized Tax Loss Harvesting: A Simple Algorithm and Framework,” they showed that harvesting losses each day offered virtually zero advantage over a monthly cadence in terms of its yield to active weight trade-off: “Transacting monthly reduces operational costs and also ensures that the wash-sale rule is satisfied inherently, thereby reducing operational risk. As a result, our proposed portfolio harvesting algorithm operates at a monthly cadence.” Following their rule from the 2022 study, they triggered a harvesting event when a stock’s price had declined more than 10%.
First, they imposed stock-level active weight limits. This restriction did not bind for the majority of stocks with low benchmark (or target) weights but restricted excessive underweighting in large benchmark names. Next, they imposed sector-level active weight constraints, which prevented the introduction of excessive sector underweights when correlated stocks within a sector had coinciding poor performance. Finally, they imposed minimum transaction size limits that prevented small nuisance transactions that might not also justify any fixed transaction costs.
Their analysis confirmed their intuition: Harvesting losses in a stock portfolio realized about 2.5 times the losses realized when owning ETFs over a five-year period, and the long-term equilibrium harvesting yield was about 4 times higher in a stock portfolio. In fact, in almost 30% of their simulations, there never existed an opportunity to harvest a loss of greater than 5% when owning ETFs. The difference in performance was so stark that the bottom fifth percentile of loss-harvesting performance for direct stocks was greater than the average performance for ETFs.
Consistent with the research we have reviewed, among their other findings were:
- Their calibrated algorithm for a diversified U.S. equity portfolio was expected to harvest about 60% of the initial investment over a 20-year period. Assuming those capital losses could offset short-term capital gains, which were taxed at a rate of approximately 40%, the annualized benefit to tax deferral was approximately 1.2%.
- Harvested losses tended to be front-loaded—about one third of losses harvested over a 20-year period occurred in the first 2.5 years.
- There could be considerable variation in losses harvested over two decades depending on market conditions. The 90% confidence interval for losses harvested over 20 years ranged from 30% to 85%.
- Incremental harvested losses closely tracked the performance of the market. Poorly performing markets presented greater harvesting opportunities. Strongly performing markets presented fewer opportunities, although opportunities could still occur because of considerable idiosyncratic variation in stock performance.
Using Leverage and Long-Short Strategies
Joseph Liberman, Stanley Krasner, Nathan Sosner, and Pedro Freitas, authors of the 2023 study “Beyond Direct Indexing: Dynamic Direct Long-Short Investing” published in The Journal of Beta Investment Strategies, Direct Indexing Special Issue 2023 (Vol. 14, Issue 3), examined if the utilization of leverage and long-short strategies motivated by the literature on factor-based investing could improve on the tax benefits of direct indexing and tax-loss harvesting. They began by noting that, while tax-loss harvesting can be beneficial for those investors whose other investments tend to realize short-term capital gains, without the help of additional capital contributions or gifting of appreciated stocks, direct indexing strategies typically realize only a limited amount of net capital losses. For example, Israelov and Lu showed in their 2022 paper that realized net losses of a long-only tax-loss harvesting strategy decline quickly over time. Liberman, Krasner, Sosner, and Freitas explained: “According to their estimates, the realized net loss is expected to be about 13% in the first year since inception, then decline to high single digits in the second year, and after that gradually decay to mid and low single digits in years three and beyond.”
They modeled three types of tax-aware strategies. The first one was a direct indexing strategy. The other two represented alternative approaches to long-short factor investing that differed in the way they implemented index beta. Strategies of the first type expressed index beta using individual stocks. For example, a 150/50 strategy would hold 150% of its net asset value in long stocks and 50% of its NAV in short stocks. They referred to these strategies as “relaxed-constraint.” In contrast, strategies of the second type implemented index beta by holding an index fund, such as a passive mutual fund or an ETF, and only used individual stocks to put on long and short extensions. For example, a 150/50 strategy would hold 100% of its NAV in an index fund, 50% of its NAV in long stocks, and 50% of its NAV in short stocks. They called these “composite long-short.”
They then introduced these tax-aware strategies with different levels of leverage and tracking error. Their data sample and strategies were constructed over the Russell 1000 Index universe and tracked the Russell 1000 Index performance. All the strategies were rebalanced at a monthly frequency. In each rebalance, the strategy sought to defer tax gains and realize tax losses while maintaining a tracking error of 1% with respect to the benchmark index for the long-only direct indexing strategy. The tax-aware long-short factor strategies were modeled as follows.
In each monthly rebalance, relaxed constraint strategies maximized expected active pretax returns, deferred gains, and realized losses subject to tracking error and leverage constraints. They derived expected active pretax returns from an alpha model based on value, momentum, and quality investment themes, or factors, with each factor receiving an equal risk weight. They modeled three levels of leverage and tracking error: 150/50 at 2% tracking error, 200/100 at 4% tracking error, and 250/150 at 6% tracking error.
The composite long-short strategies consisted of a passive hypothetical Russell 1000 Index fund and beta-zero, long-short portfolios of individual stocks (market-neutral portfolios).
They simulated 27 10-year-long histories. The simulations began in January of each year from 1986 to 2012, with the last 10-year simulation beginning in January 2012 and ending in December 2021. After a strategy was seeded on the first day of the simulation, there were no contributions or redemptions of capital during the simulation period. For computing tax benefits, they used the top federal tax bracket rates in the year 2022 inclusive of 3.8% net investment income tax: 40.8% for short-term capital gains and ordinary income, and 23.8% for long-term capital gains and qualified dividend income. Tax benefits were computed monthly as a percentage of the month’s beginning NAV and then annualized. They assumed that capital gains were taxed according to their character (short term at 40.8% rate and long term at 23.8% rate), all capital losses (whether long-term or short-term) were used to offset only long-term capital gains, and a 10% effective tax rate was applied to incremental unrealized gains. Here is a summary of their key findings:
- On average, net losses offered by direct indexing tapered off after the first few years since inception—the cumulative net capital loss amounted to 13% in year one, crossed a 20% mark in year three, and moved closer and closer toward 30% in the last five years of the 10-year simulations.
Direct Indexing Strategy: Cumulative Net Capital Loss Realization
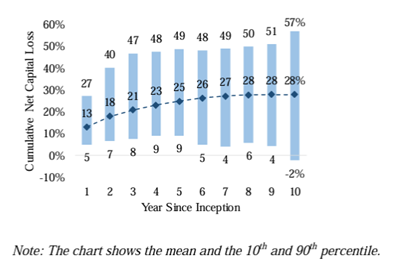
- Because of their sensitivity to market environment variables—market return and stock-level volatility—direct indexing strategies had a very substantial dispersion of net loss outcomes, including in year one. After half a decade of investing in the direct indexing strategy, the cumulative net capital loss could be as high as approximately 50% (or more) with 10% probability or as low as approximately 5% (or less) with 10% probability.
- On average, during the entire 10-year simulation period, the gross-of-costs pretax alpha of the direct indexing strategy was approximately zero—the strategy successfully tracked the index. In years one to five, the average annual turnover of the strategy was 155% of the NAV, which led to a small negative net-of-costs pretax alpha of negative 12 basis points. However, this pretax underperformance relative to the benchmark was more than compensated by a tax benefit estimated to be 69 basis points on average, with the 10th and 90th percentiles at 40 basis points and 118 basis points, respectively. As the portfolio matured, the tax benefits were reduced. The tax benefit in years six to 10 was 9 basis points on average, with the 10th and 90th percentiles at negative 2 and 27 basis points, respectively. The average annual turnover of the strategy, mostly induced by loss-realization trades, declined accordingly to 55% of the NAV.
- The ability to realize net tax losses per dollar of the NAV generally increased with leverage because position sizes, and thereby potential economic losses, became larger relative to the NAV. For example, relaxed constraint 150/50 on average realized a 100% cumulative net capital loss in about seven years. After nine years, fewer than 10% of the simulated vintages realized a capital loss less than 100%. The higher leverage strategies achieved a 100% capital loss faster. For relaxed constraint 200/100, it took less than three years on average to realize a 100% cumulative net capital loss, and after four years fewer than 10% of the vintages failed to achieve a 100% capital loss. Relaxed constraint 250/150 reached a 100% capital loss in less than two years, and only about 10% of the vintages failed to realize a 100% capital loss after two years. Composite long-short strategies produced similar results, though with wider dispersion of outcomes in the later years.
- For the leverage-tracking error combinations, reduction in tracking error reduced capital losses and tax benefits, as a tighter tracking error constraint began to limit the opportunities for deferring the realization of gains. The opposite was also true: By taking a greater economic risk, and thereby a greater exposure to the alpha model, an investor could also increase the tax benefits derived from the strategy.
- Relaxed constraint and composite long-short strategies had a high level of alpha-model-induced turnover. For those strategies, tax-aware optimization helped achieve a desired level of alpha-model exposure without sacrificing tax efficiency—for factor-based strategies, tax efficiency comes not from accelerating losses but rather from slowing down the realization of gains.
- Both relaxed constraint and composite long-short strategies significantly outperformed the direct indexing strategy from both a pretax and tax perspective, although the dispersion of outcomes was somewhat larger under composite long-short than under relaxed constraint.
Their findings led Liberman, Krasner, Sosner, and Freitas to conclude: “Relaxed constraint and composite long-short are comparable approaches to long-short investing, and that, depending on investor’s legacy positions and portfolio composition preferences, either of these two approaches can be deployed with similar effectiveness.” They also offered this caution: “Long-short strategies, by construction, expose investors to active risk of the alpha model (measured by tracking error), costs of financing the long and short extensions, and increased t-costs associated with the active management. Investors might want to modulate these risks and costs in accordance with their expectations about the strategy’s pre-tax alpha.”
They explained: “Leverage and tracking error can be increased in just one portfolio rebalance without any adverse tax consequences. Pre-tax alpha of the levered-up strategy increases going forward because of its higher exposure to the alpha model. Tax benefits also increase because new positions with fresh cost basis are created on both long and short sides of the portfolio thereby increasing future opportunities for managing the realizations of capital gains and losses. Going in the opposite direction, that is, tax efficiently reducing leverage and tracking error of a low-basis long-short portfolio is harder. Portfolio positions must be liquidated, and, given that many of the positions carry built-in gains, such liquidation might lead to substantial gain recognition.” With that said, tax-efficient reduction in leverage and tracking error for a low-basis long-short portfolio could still be achieved: “However, in contrast to levering up the portfolio, the process of levering down without creating an unnecessary tax burden can take multiple years. For our tax-aware RC and CLS strategies, we find that the de-risking process might indeed take several years but the strategy’s portfolio cannot be de-risked all the way to a long-only passive portfolio without recognizing substantial capital gains. However, our experiments achieve a meaningful reduction in leverage and tracking error without triggering net capital gains. After de-risking, the level of pre-tax alpha and tax benefits is reduced, which is expected given a lower tracking error and leverage and a large number of appreciated positions remaining in the portfolio.”
Investor Takeaways
In the past, a hurdle to benefiting from realized losses has been transactions costs. However, with the decimalization of prices, reduction in commissions/fees from broker/dealers and custodians, and the competition from high-frequency traders, trading costs have fallen sharply, reducing that hurdle. In addition, financial technology has greatly improved, and custodians are required to track cost basis, making reporting much easier. As tax-aware investing, including tax-aware long-short investing, has become more cost-effective, it has become more important for investors.
Among the key takeaways is that even direct indexing strategies need to deviate from benchmark weights to achieve their loss-harvesting benefits, carrying the risk of underperformance (tracking error) relative to the benchmark. In addition, direct indexing strategies will have higher transaction costs, which result from the loss-harvesting trades, and possibly higher management fees because of added complexity. Leverage and shorting can further increase risks and costs of tax-aware strategies. And the tracking error of strategies that utilize leverage and shorting will likely be higher than that of direct indexing, leading to a higher risk of underperforming the benchmark. With that said, these strategies will likely have greater opportunities to realize capital losses than direct indexing, though they will have greater turnover and thus higher transactions costs. In addition, higher leverage leads to financing costs, and the higher complexity of managing long-short strategies will likely result in higher management fees.
Another takeaway is that while direct indexing and tax-loss harvesting provide benefits, the low average level and high uncertainty of the net losses realized by direct indexing present a challenge for investors looking to use the strategy’s net losses in their tax planning (for example, in dealing with low-basis concentrated positions). The research we covered demonstrates that tax-aware long-short factor strategies are better suited for such situations, as they allow investors to enjoy not only substantial tax benefits but also a diversifying pretax alpha derived from factor investing. With that said, the results demonstrated that the speed with which 100% cumulative net capital loss is achieved by relaxed constraint and composite long-short strategies depends on the level of leverage and tracking error an investor is prepared to tolerate. Said differently, economic risk and tax benefits are correlated.
The views expressed here are the author’s. Larry Swedroe is head of financial and economic research for Buckingham Wealth Partners, collectively Buckingham Strategic Wealth, LLC and Buckingham Strategic Partners, LLC.
For informational and educational purposes only and should not be construed as specific investment, accounting, legal, or tax advice. Certain information is based on third party data and may become outdated or otherwise superseded without notice. Third party information is deemed to be reliable, but its accuracy and completeness cannot be guaranteed. Indices are not available for direct investment. Their performance does not reflect the expenses associated with the management of an actual portfolio nor do indices represent results of actual trading. Information from sources deemed reliable, but its accuracy cannot be guaranteed. Performance is historical and does not guarantee future results. All investments involve risk, including loss of principal. By clicking on any of the links above, you acknowledge that they are solely for your convenience, and do not necessarily imply any affiliations, sponsorships, endorsements or representations whatsoever by us regarding third-party websites. Buckingham is not responsible for the content, availability or privacy policies of these sites, and shall not be responsible or liable for any information, opinions, advice, products or services available on or through them. Neither the Securities and Exchange Commission (SEC) nor any other federal or state agency has approved, determined the accuracy, or confirmed the adequacy of this article. LSR-23-563
Larry Swedroe is a freelance writer. The opinions expressed here are the author’s. Morningstar values diversity of thought and publishes a broad range of viewpoints.
The author or authors do not own shares in any securities mentioned in this article. Find out about Morningstar’s editorial policies.
/cloudfront-us-east-1.images.arcpublishing.com/morningstar/L4B22R7UFVDBJN2ZYJWBSMCIJA.jpg)
/cloudfront-us-east-1.images.arcpublishing.com/morningstar/BL6WGG72URAJJJCPC4376SZKX4.png)
/cloudfront-us-east-1.images.arcpublishing.com/morningstar/ZHBXSNJYDNAY7HDFQK47HGBDXY.png)
:quality(80)/s3.amazonaws.com/arc-authors/morningstar/8c5d95ea-6364-418e-82fc-473134024ece.jpg)